Below you will find the statistical breakdown and more for the Phoenix area Real Estate Market for January 2019.
View All Current & Past Phoenix & East Valley Real Estate Market Reports
Below is a snapshot of January’s Real Estate Market Statistics for Phoenix AZ:
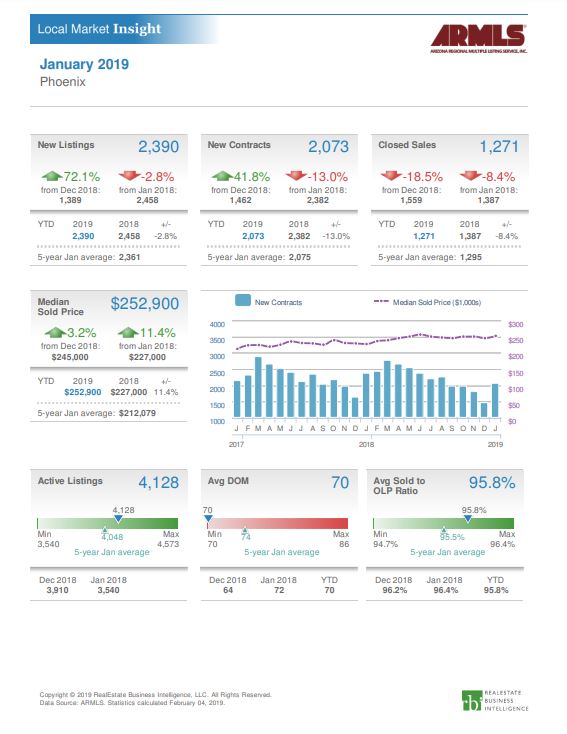
The number of new listings in Phoenix for January was 2390 up 72.1 % from December 2018. But in addition, new contracts also increased by 41.8% to 2073. We saw 1271 home sales completed in January down 18.5% from December. Median sales price was $252,900 up 3.2% from December. There were 4128 active listing in Phoenix with the average days on market of 70. The average sold price to list price was 95.8% down by .4% from prior month.
Phoenix Homes for Sale by Bedrooms & Median price:
What does this mean if you are a seller?
For sellers, understanding that inventory levels in January normally increase. This January was no different. We were up 72.1% vs December. Also, closed sales decreased by 18.5%. This caused the current months of inventory available for Sale to increase by 29.5% to 3.25. This puts us in a balanced market for the first time in a few years. Sellers will need to adjust their expectations on receiving multiple offers during the first week on the market unless they are exceptionally priced. For January, we saw the list to contract price at 95.8% down by .4% from December. We also saw the median price increase by 3.2% to $252,900.
What does this mean if you are a buyer?
For buyers, a inventory of 3.25 months (compared to 2.51 months in December) is welcome news since this indicates we have moved into a balanced market. A balanced market neither favors the buyer or the seller. As a buyer, you will see an increase in inventory to choose from. The buyer will also be in a move advantagious negotiating positions than he has been in the last couple of years. However this is a balanced market, not a buyers market, so you will still need to reasonably price your offer.
Homes For Sale in Phoenix AZ:
Below are Homes that have come on the Market in the last 7 Days around the Median price range. Also below the pictures, you will see a Chart of all the Phoenix homes by price and Type:
Below are all the Homes available in the city of Phoenix by Dollar amount and type:
Below you will see the links for the other cities in the East Valley:
View All Current & Past Phoenix & East Valley Real Estate Market Reports