Tempe Market report for April 2017.
View All Current & Past Phoenix & East Valley Real Estate Market Reports
Below are all the Homes available in the city of Tempe by Dollar amount and type:
Navigate this Market Report:
- March Statistics
- What does this Data Mean?
- Understanding the Data if you are a Seller/Buyer
- Market Statistics for Surrounding Cities
Below is a snapshot of March’s Real Estate Market Statistics for Tempe:
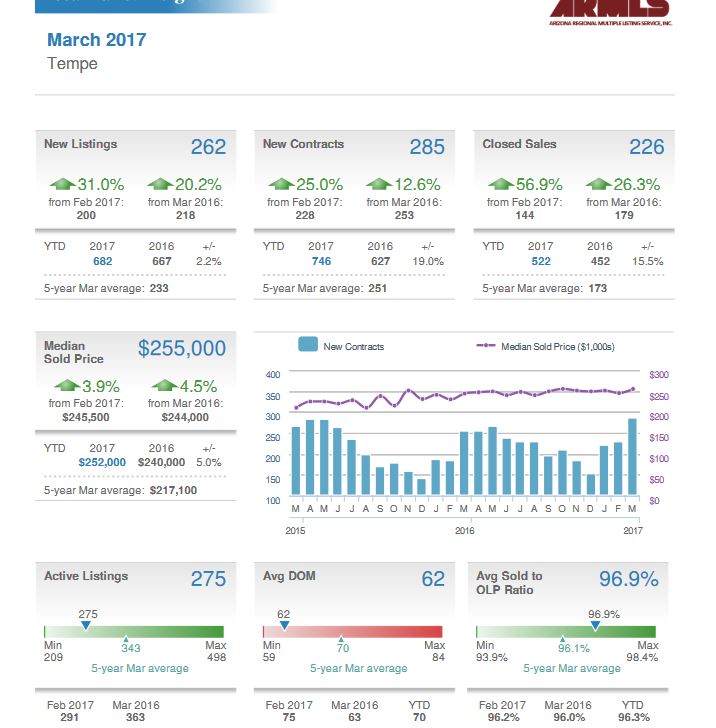 For the Tempe area, new listings in March 2017 were up from February 2017 by 31%. New contracts in March were up 25% from February. Closed sales were up by 56.9 %. The median sold home price was $255,000, up 3.9% from February. The average number of days for a home to be on the market in Tempe decreased to 62 days. The list to sold price increased to 96.9%
Tempe Homes for Sale by Bedrooms & Median price:
How should this Data be interpreted?
We saw new listings in Tempe increase to 262, while homes under contract increased to 285. Closed sales for March were up, at 226 homes. We saw the median sold price increase to $255,000. Active listings are down at 275 homes, and average days on the market decreased to 62 days. The average sold to list price increased to 96.9%.
Tempe experienced an increase in inventory on the market over February by 31.0%, while homes under contract were up by 25.5%. Closed sales also increased by 56.9%. The average day’s homes were on the market in Tempe decreased from 75 days to only 62 days. The sale to list price for Tempe increased from 96.2% to 96.9%
What does this mean if you are selling a Home in Tempe?
As a seller, we saw inventory levels increased and so did the homes under contract. For March, we saw average days on the market decrease from 75 days to 62 days. If priced correctly, sellers can expect to sell in less than the average 62 days. Buyers are not going to overpay, but houses priced correctly and in good condition will sell, often with multiple offers. For March, we saw the list to contract price was 96.9%, up slightly from 96.2% in February. We also saw the median price increase $245,500 to $255,000.is continues to be a good time to sell.
![]()
What does this mean if you are buying a Home in Tempe?
Inventory is up in Tempe month over month, and sales are up, absorbing the new listings. Homes are selling faster and for more money. With only 1.2 months of inventory, buyers need to be quick when making decisions and put forth their best offer. Buyers have less inventory to choose from and homes are selling closer to list price. A serious buyer should think carefully and discuss with their real estate agent whether asking for seller concessions and offer significantly below list price is good strategy.
Below are Homes that have come on the Market in the last 7 Days around the Median price range. Also below the pictures, you will see a link to additional homes in this price range:
Since we are focusing on the Market Statistics for East Valley locations, below you will see the links specifically for those cities:
View All Current & Past Phoenix & East Valley Real Estate Market Reports