Before we get into the Chandler Real Estate Market Report April 2020, I have a commentary written by Tina Tamboer. Tina is the Senior Housing Analyst with the Cromford report. She was nice enough to let us use her summary of the Greater Phoenix Metro area as a backdrop for what is happening in April 2020. Here is her commentary…..
The Greater Phoenix Metro Summary Analysis Report
Pandemic Puts Housing in a “Pinch”
COVID-19 Aftermath: Good News for Normal Buyers
For Buyers:
The kickoff of 2020 was developing into a nightmare for normal buyers who just wanted to find a place to live. Extreme competition for homes between wholesalers, cash buyers, vacation rental investors, and traditional buyers depleted supply and created an environment consisting of multiple offers, appraisal waivers, and an increasing number of sales over asking price. The Greater Phoenix housing market was on the precipice of seeing price appreciation accelerate at an alarming rate and had analysts wondering what could possibly slow it down. Well, they have their answer; an act of nature.
? Impact of COVID-19
The COVID-19 pandemic came in like a wrecking ball in March shutting down tourism and crashing the stock market single-handedly over the course of a few weeks. Hedge funds and iBuyers (funded by Wall Street) bowed out of purchases and vacation rental buyers put their plans on hold. This is providing much-needed relief to normal homebuyers, if only they could leave their house.
Stay-at-home orders to stem the impact of the pandemic has “pinched the hose” on what is arguably one of the hottest housing markets in the country. This is causing a build-up of pent up demand that will undoubtedly return with some gusto when travel restrictions are lifted and a level of stability returns.
Don’t expect prices in Greater Phoenix to drop as they did in 2008, however. Back then when investors pulled out of the market, prices were so high that families making the median income could only afford 27% of what was selling. This time around as investors once again pull out of the marketplace, families making the median income can afford 68% of what’s selling with today’s incomes and interest rates. This is well within normal range and puts regular homebuyers in a better position to pick up the pieces left by Wall Street and vacation rental investors.
For Sellers:
Lockdowns and travel restrictions across the country are causing buyers who need to relocate to Arizona, either for a job or to retire, to put those plans on hold for now. The effects of COVID-19 span the job market, stock market, corporate profits, and exchange rates. This has had the highest impact on high-end luxury market buyers. Not only are these buyers restricted from leaving their home cities at the moment, but they also have instability in their portfolios as well. Under these circumstances it should not come as a surprise to see that weekly contract activity over $500K has slowed down by 64% since their peak on February 24th while price points under $500K have only seen a 30-40% slow down.
? Impact of COVID-19
Sale prices are not declining at the moment, but seller expectations are adjusting. Upticks in weekly price reductions tell us that sellers are beginning to ease up on pushing market value. Sellers are also beginning to realize that it will take longer to sell their homes under these conditions. Weeks ago, some listings were receiving multiple offers within a matter of hours, but that’s not a reasonable expectation now.
Active listings that would’ve flown off the market 4 weeks ago could be on the market for weeks, maybe even months at this rate. Information, communication, and strategy will be important during the course of the pandemic response. It’s situations like these where professional Realtors get to show the value of their experience and service.
The commentary was written by Tina Tamboer, Senior Housing Analyst with The Cromford Report
©2020 Cromford Associates LLC and Tamboer Consulting LLC
Below you will find the statistical breakdown and more for the Chandler area Real Estate Market Report March 2020.
View All Current & Past Phoenix & East Valley Real Estate Market Reports
Below is a snapshot of Chandler’s Real Estate Market Statistics for March 2020
?️ What are the Average Temperatures in the Phoenix Metro area?
| Month | Low | High |
|---|---|---|
| Jan | 43.4°F | 65.0°F |
| Feb | 47.0°F | 69.4°F |
| Mar | 51.1°F | 74.3°F |
| Apr | 57.5°F | 83.0°F |
| May | 66.3°F | 91.9°F |
| Jun | 75.2°F | 102.0°F |
| Jul | 81.4°F | 104.2°F |
| Aug | 80.4°F | 102.4°F |
| Sept | 74.5°F | 97.4°F |
| Oct | 62.9°F | 86.4°F |
| Nov | 50.0°F | 73.3°F |
| Dec | 43.5°F | 65.0°F |
Phoenix’s coldest month is January when the average temperature overnight is 43.4°F. In July, the warmest month, the average day time temperature rises to 104.2°F.
If you would like to see specific homes as they come on the market, click here to get email updates.
? A look at Chandler’s current Sales Price. Real Estate Market Report
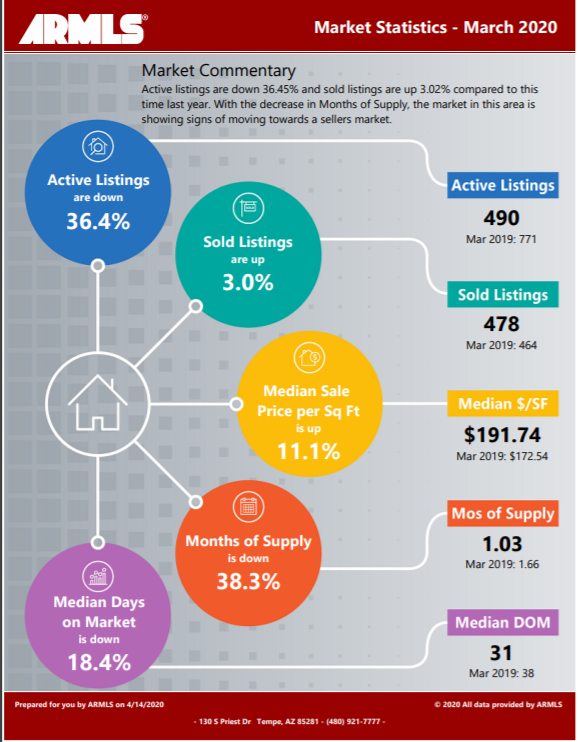
In March, Chandler’s Median Sales Price was $355,000 as compared to last month’s $349,000. We will see how the Virus effects sales price going forward. Based on Tina’s comments they are holding so far.
If you are in the process of Buying or Selling a Home, Click on the highlighted link to see a number of interesting articles.
What does this mean if you are a Seller or a Buyer for the Chandler Real Estate Market Report April 2020
Real Estate Market Report
As the chart above shows, Inventory in Chandler is at 1.03 months down from last month’s .90. Also, with all the Coronavirus restrictions, both buyers and sellers are greatly impacted (see Tina’s comments above). At this point, the only thing we know for sure is the whole market is slowing.
If you would like to see specific homes as they come on the market, click here to get email updates.
?️ What is the annual rainfall in Phoenix?
Average Rainfall for Phoenix

| Month | Precipitation |
|---|---|
| Jan | 0.83in. |
| Feb | 0.77in. |
| Mar | 1.07in. |
| Apr | 0.25in. |
| May | 0.16in. |
| Jun | 0.09in. |
| Jul | 0.99in. |
| Aug | 0.94in. |
| Sept | 0.75in. |
| Oct | 0.79in. |
| Nov | 0.73in. |
| Dec | 0.92in. |
The driest month in Phoenix is June with 0.09 inches of precipitation, and with 1.07 inches March is the wettest month.
?️ Homes For Sale in Chandler AZ and the Chandler Real Estate Market Report April 2020
Below are Homes that have come on the market in the last 7 Days around the Median price range. Also below the pictures, you will see a Chart of all the Chandler homes by price and Type:
Below are all the homes available in the city of Chandler by Dollar amount and type:
? Below you will see the links for the other cities in the East Valley:
View All Current & Past Phoenix & East Valley Real Estate Market Reports
Contact the Shirley Coomer Group at Keller Williams Realty Sonoran Living
![]()
Call or Text: 602-770-0643 for more Real Estate Information.