Chandler Real Estate Market report for March 2017.
View All Current & Past Phoenix & East Valley Real Estate Market Reports
Below are all the Homes available in the City of Chandler by Dollar amount and type:
Navigate this Market Report:
- February Statistics
- What does this Data Mean?
- Understanding the Data if you are a Seller/Buyer
- Market Statistics for Surrounding Cities
Below is a snapshot of February’s Real Estate Market Statistics for Chandler:
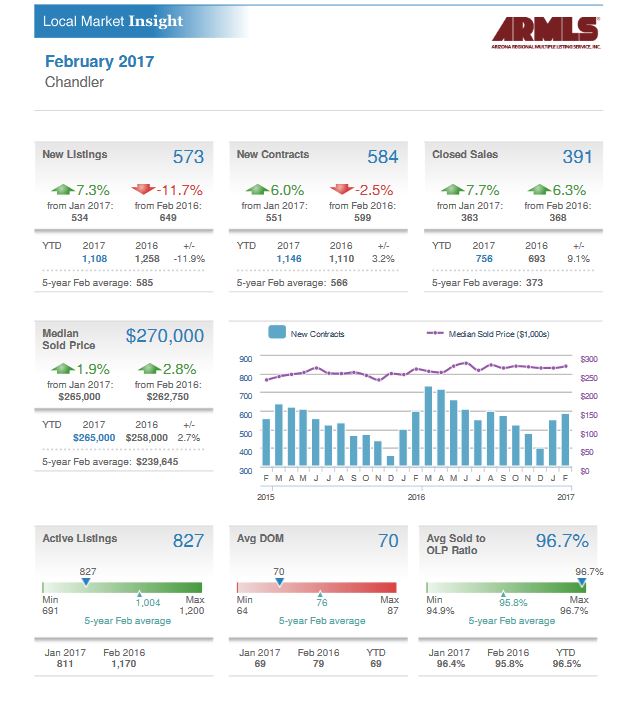
For February 2017, the median price of a home in Chandler was $270,000. The “median” price is the middle of all homes sold.
The average days on the market for homes sold in Chandler for January 2017 was 70 days. The list price to sales price was 96.7%.
Chandler Homes for Sale by Bedrooms and Median Price:
How should this Data be interpreted?
Average sale price in Chandler increased to $270,000, up from January. Average days on market was flat at 70 days, compared to January at 69 days. The sale to list price inched up slightly at 96.7% compared to 96.4% in January. The months of inventory decreased from 2.23 to 2.12. Why is this number important?
A key calculation Real Estate agents use to track is how fast the Housing Inventory is turning is how many months of inventory is on hand. When we divide the number of properties on the market by the number sold we determine how many months of inventory is available. Typically, when we are under three months of inventory this is considered a Seller’s market. This means there is more competition for homes, and homes typically sell closer to list price, and often with multiple offers. The real estate community generally considers under 3 months of inventory to indicate a seller’s market, while more than 4 months of inventory is moving towards a buyer’s market.
What does this mean if you are selling a home in Chandler?
As a seller, we see that inventory levels are up slightly from January, and sales are up. For February, we saw average days on the market of 70 days, which is flat with January’s 69 days. If priced correctly, sellers can expect to sell in less than the average 70 days on the market we saw in February. Buyers are not going to overpay, but houses priced correctly and in good condition will sell, often with multiple offers. For February, we saw the list to contract price was up from 96.4% to 96.7%. We also saw the median price increase from $265,000 to $270,000. Good news for sellers.
![]()
What does this mean if you are buying a home in Chandler?
For buyers, this means there is a bit more inventory on the market to choose from, and those homes sold were sold for more money with more competition. The median price in Chandler continues to increase. The months of inventory decreased slightly from 2.23 months to 2.12 months. Homes priced correctly relative to location and condition are selling closer to the original list price. If you are serious about an offer, have your agent provide you comparable properties to determine the best price for the house. Asking for seller concessions and making a lowball offer is not a good strategy in a seller’s market. Remember, sellers also know the value of their home in this market. Their agents are keeping sellers updated on recent sales and homes similar to theirs as they come on the market.
Below are Homes that have come on the Market in the last 7 Days around the Median price range. Also below the pictures, you will see a link to additional homes in this price range:
Since we are focusing on the Market Statistics for East Valley locations, below you will see the links specifically for those cities:
View All Current & Past Phoenix & East Valley Real Estate Market Reports