Before we get into the Phoenix Real Estate Market Report December 2019, I have a commentary written by Tina Tamboer. She is the Senior Housing Analyst with the Cromford report. She was nice enough to let us use her summary of the Greater Phoenix Metro area as a backdrop for what is happening in Phoenix this month. Here is her commentary…….
The Greater Phoenix Metro Summary Analysis Real Estate Market Report
19% of Homes Sold Over Asking Price
24% of Sellers Agreed to Closing Cost Assistance
For Buyers:
Supply shortages created an environment of multiple offers and listings sold over asking price last month. This is especially evident among listings between $125K-$250K where 26% sold over asking price in November compared to the overall percentage of 19% in Greater Phoenix. In a normal market, we would expect 10-15% of listings to be sold over asking price.
That statistic may sound hopeless to a buyer who may not have the means or stomach to pay over asking price. However, 24% of sellers agreed to pay some form of closing cost assistance to buyers in November as well. This measure increases to 32.5% on sales between $125K-$250K, the primary price point for first-time home buyers.
The West Valley has the largest share of homes listed between $125K-$250K at 46%. Pinal County has 31%, the Northeast Valley has 12% and the Southeast Valley has just 10%. Given this information, it’s not surprising that the West Valley has both a large share of transactions involving seller-paid closing costs combined with a higher-than-average percentage of homes sold over asking price. Pinal County, on the other hand, has a large percentage of seller-paid closing costs, but a lower-than-average percentage of homes sold over list price.
For Sellers:
More expensive areas with average sale prices over $500K have significantly fewer sales involving seller-paid closing costs (as would be expected) and a much lower-than-average percentage of homes sold over asking price, but things have been exciting for this market so far this year. Sales over $500K are up over 16.5% year-to-date over last year, but most impressive is the 21% increase in sales over $2M! Typically the second half of the year is flat for luxury sales in this range, but this year contracts in escrow have soared 42% over 2018’s level in the last 3 months.
Also impressive is a 24% gain in sales between $500K-$600K, which was helped by an increase in the FHFA loan limit to $484,350 last year. In 2020, that limit is set to rise again to $510,400. This means it may get a little easier for buyers to qualify for more expensive homes and that’s good news for sellers.
Sellers in the mid $300K price range are getting a boost too. FHA is raising their loan limit in 2020 from $314,827 to $331,760. FHA financing is an option for buyers who may have less-than-favorable credit and lower down payments. This is good news for both buyers who can’t move up in price due to the existing limit and sellers who are just out of reach for these buyers.
Below you will find the statistical breakdown and more for the Phoenix area Real Estate Market Report December 2019 ( with prior month and year data).
View All Current & Past Phoenix & East Valley Real Estate Market Reports
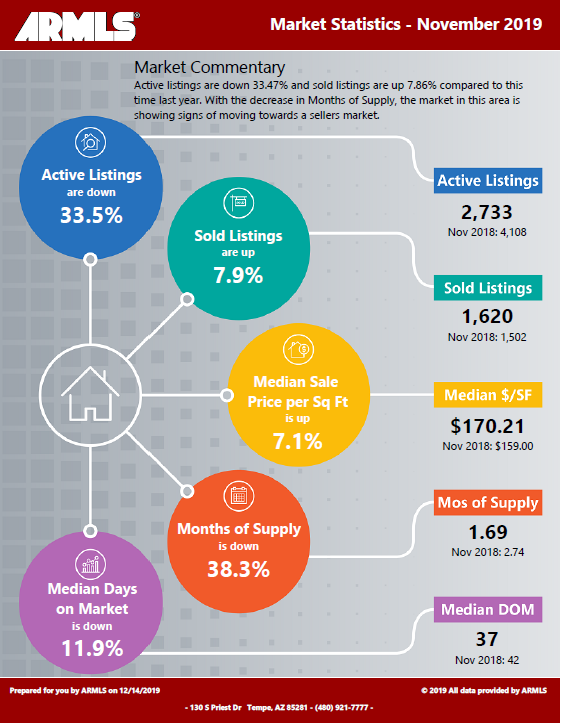
Below is a snapshot of Phoenix’s Real Estate Market Statistics for November 2019.
A look at Phoenix’s current Sales Price. Real Estate Market Report
In November, Phoenix’s Median Sales Price was $260,000 as compared to October’s $265,000( a 1.9 decrease). Currently, the YTD average Median price in Phoenix is $257,000. Homes in the $200,000-$300,000 range were a higher percentage of sales for the month.
If you are in the process of Buying or Selling a Home, Click on the highlighted link to see a number of interesting articles.
What does this mean if you are a Seller or Buyer?
Real Estate Market Report
As the chart above shows, Inventory in Phoenix is at 1.69 months up slightly from last months 1.60%. This the second month in a row with a slight increase. The forecasters still believ that inventory levels will remain low for the foreseeable future. Sellers have the advantage due to such few Homes on the Market.
Buyers will have to make competitive offers. Also, as few contingencies as possible. Buyers will need to act quickly. So they can beat out the competition with the offer.
If you would like to see specific homes as they come on the Market, click here to get email updates.
Homes For Sale in Phoenix AZ
Below are Homes that have come on the Market in the last 7 Days around the Median price range. Also below the pictures, you will see a Chart of all the Phoenix homes by price and Type:
Below are all the Homes available in the city of Phoenix by Dollar amount and type:
Below you will see the links for the other cities in the East Valley:
View All Current & Past Phoenix & East Valley Real Estate Market Reports
Contact the Shirley Coomer Group at Keller Williams Realty Sonoran Living
![]()
Call or Text: 602-770-0643 for more Real Estate Information.