Before we get into the Phoenix Real Estate Market Report for June 2020, I have a commentary written by Tina Tamboer. Tina is the Senior Housing Analyst with the Cromford report. She was nice enough to let us use her summary of the Greater Phoenix Metro area as a backdrop for what is happening in Phoenix this month. Here is her commentary…..
?️ The Greater Phoenix Metro Summary Analysis Real Estate Market Report
Frenzy Is Back – 23% of Sales Close Over Asking Price
Luxury Rebound – Contracts Over $500K Up 159%
? For Buyers:
Greater Phoenix is officially back to a frenzy market with more properties under contract than available for sale. Over the past 4 weeks the number of contracts accepted weekly has jumped another 20% since last month’s report, bringing the total recovery since April 5th to 68% and 2.5% higher than it was in late February; before the stock market crashed and the stay home orders were imposed due to COVID-19.
The most frenzied areas are those with average sale prices between $200K-$400K. That includes just about all of Southeast Valley and West Valleyfore vacation rentals began flooding the market for sale. Inventory rose 35% over the course of 4-5 weeks and peaked in mid-April. Since then, inventory has consistently dropped week over week and now lies at 11,232; just 145 more listings than before this whole situation began.
Low-interest rates and positive affordability indicators continue to fuel demand and cause prices to rise. The big question buyers, North and South Phoenix. At last count, there were 2,061 properties for sale between $200K-$300K and 4,333 under contract already. Between $300K-$400K, there were 2,006 available for sale and 3,017 under contract (24% higher than this time last year).
All price ranges have rebounded in contract activity
Even though there was more contract activity in all areas, May saw the largest comeback between $500K-$1M where the number of accepted contracts soared 167% from a low of 148 contracts the first week of April to 395 the first week of June. That’s 58% higher than last year’s count in the same week of 250 contracts. Even more dramatic, contracts over $1M are now up 85% compared to this week last year.
The result for buyers is an inventory that’s back to a pre-pandemic low. In our March update, inventory was at a historic low of 11,087 listings. Buyers ask, “Is it still a good time to buy?”. The answer is yes, for now. Affordability is still within the normal range, which is a good reason why there’s so much demand. However, if affordability drops below the normal range for those making the median family income, then the market will begin to cool. We are not there yet. It’s best to get in while it’s affordable.
? For Sellers:
Not surprisingly, there is an increasing percentage of closings over asking price. 23% of all closings so far in June have recorded over asking price, up from 17% recorded in January and 19% recorded in February. That percentage increases to 38% for closings between $200K-$250K and 27% between $250K-$300K. It’s not uncommon for sellers to experience multiple offers, escalation clauses and appraisal waivers in today’s environment. In fact, there have been reports of 70 competing offers or more on homes under $300K.
Sellers who have been on the fence about listing their home lately should seriously consider it now and take advantage while the market is hot. This spurt in buyer activity may peak very soon and then fall into the typical seasonal decline the Greater Phoenix market experiences every year from July to December. Pent up demand from the pandemic is now being released, but there’s no guarantee that it will continue at this level for long. If you planned to sell your home this year, now is the time to list it.
The commentary was written by Tina Tamboer, Senior Housing Analyst with The Cromford Report
©2020 Cromford Associates LLC and Tamboer Consulting LLC
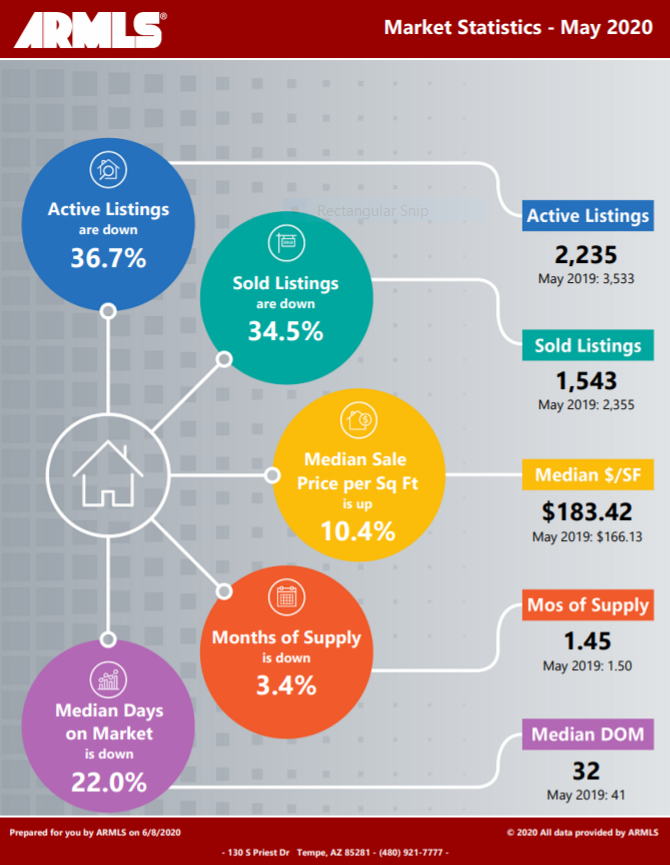
Below you will find the statistical breakdown and more for the Phoenix area Real Estate Market Report May 2020.
View All Current & Past Phoenix & East Valley Real Estate Market Reports
You may also be interested in reading about Seller Closing Costs in Phoenix, Az.
? Below is a snapshot of Phoenix Real Estate Market Statistics for May 2020
?️ What are the Average Temperatures in Phoenix?
| Month | Low | High |
|---|---|---|
| Jan | 43.4°F | 65.0°F |
| Feb | 47.0°F | 69.4°F |
| Mar | 51.1°F | 74.3°F |
| Apr | 57.5°F | 83.0°F |
| May | 66.3°F | 91.9°F |
| Jun | 75.2°F | 102.0°F |
| Jul | 81.4°F | 104.2°F |
| Aug | 80.4°F | 102.4°F |
| Sept | 74.5°F | 97.4°F |
| Oct | 62.9°F | 86.4°F |
| Nov | 50.0°F | 73.3°F |
| Dec | 43.5°F | 65.0°F |
Phoenix’s coldest month is January when the average temperature overnight is 43.4°F. In July, the warmest month, the average day time temperature rises to 104.2°F.
If you would like to see specific homes as they come on the market, click here to get email updates.
? A look at Phoenix’s current Sales Price. Real Estate Market Report
In May, the Phoenix housing market showed Phoenix’s Median Sales Price was $279,000 down from last month’s $290,000 ( a 3.8% drop). As Tina says above, sales levels are moving as fast as the pre-pandemic levels. Also, 23% of sales were above contract price which could mean an increase in median price going forward.
If you are in the process of Buying or Selling a Home, Click on the highlighted link to see a number of interesting articles.
❓ What does this mean if you are a Seller or a Buyer in the Phoenix Real Estate Market?
Real Estate Market Report
As the chart above shows the Phoenix housing market. The Inventory in Phoenix is at 1.45 months down from last month’s 1.76. As Tina says above, Buyers’ contract volume has moved back to pre-pandemic levels. Buyers should take advantage of the current low mortgage rates if you are ready to buy. Make your offers with as few contingencies as possible. Know the Market Value of the home because you may need to go over list price to get it.
Sellers should expect multiple offers due to the low inventory. We are seeing this creating a bidding war where buyers end up bidding above the sales price ( 23% of recent sales had this occur). Recently we have seen more cases when the appraisal is done, it comes in under the contract price and potentially causing an issue with the deal.
If you would like to see specific homes as they come on the market, click here to get email updates.
?️ What is the annual rainfall in Phoenix?

| Month | Precipitation |
|---|---|
| Jan | 0.83in. |
| Feb | 0.77in. |
| Mar | 1.07in. |
| Apr | 0.25in. |
| May | 0.16in. |
| Jun | 0.09in. |
| Jul | 0.99in. |
| Aug | 0.94in. |
| Sept | 0.75in. |
| Oct | 0.79in. |
| Nov | 0.73in. |
| Dec | 0.92in. |
The driest month in Phoenix is June with 0.09 inches of precipitation, and with 1.07 inches March is the wettest month.
You may also enjoy reading about Instant Buyers (iBuyers) in the Phoenix area.
?️ Homes For Sale in Phoenix AZ
Below are Homes that have come on the Phoenix housing market in the last 7 Days around the Median price range. Also below the pictures, you will see a Chart of all the Phoenix homes by price and Type:
Below are all the homes available in the city of Phoenix by Dollar amount and type:
? Below you will see the links for the other cities in the East Valley:
View All Current & Past Phoenix & East Valley Real Estate Market Reports
Contact the Shirley Coomer Group at Keller Williams Realty Sonoran Living
![]()
Call or Text: 602-770-0643 for more Real Estate Information.