Before we get into the Phoenix Real Estate Market Report for March 2021, I have a commentary written by Tina Tamboer. Tina is the Senior Housing Analyst with the Cromford report. She was nice enough to let us use her summary of the Greater Phoenix Metro area as a backdrop for what is happening in Phoenix this month. Here is her commentary…..
?️ The Greater Phoenix Metro Summary Analysis Real Estate Market Report
44% of Sales Closed Over Asking Price
New Listing Counts Lowest in Over 20 Years
? For Buyers:
44% of sales through the Arizona Regional MLS have closed over asking price in the last 30 days. The median amount over asking price for all price ranges combined is $10,000 with a range between $1 to $310,000. (I know what you’re thinking, “$1 over? What is this, ‘The Price is Right’?” In some cases, yes.)
While 56% of all homes still sell for at or below list price, if you have a budget between $250K-$400K, the percentage selling over list is highest at 52% with the median amount over asking at $10,000. However even if your budget is over $400K, a significant percentage is closing over asking price. Up to $800K, 42% have sold over list with a median escalation of $12,000-$15,000. From $800K-$1M, 30% sold over list with a median escalation of $17,000-$20,000. From $1M-$2.5M, 20% sold over list with a median escalation of $30,000-$50,000. Over $2.5M, only 2 sold over asking price with a median escalation of $150,000.
Over the past 6 weeks, REALTORS® have added an average of 2,059 new listings per week to the Arizona Regional MLS. During the same time period, an average of 2,312 contracts were accepted per week. This is what has caused the overall supply of homes to consistently drop and competition between buyers to escalate. While just over 2,000 new listings per week may seem like a lot, it’s actually the lowest rate for this time of year in at least 20 years. A normal level would be considered around 2,500 new listings.
? For Sellers:
While supply is still 77% below normal for this time of year and demand is 17% above normal, demand has been dropping faster than supply over the last 30 days. It’s not noticeable when one is in the midst of a contract negotiation today because sellers rarely notice when they’re getting, for example, only 15 offers instead of 25. But consider last December demand was 35% above normal; at this rate, demand could be at a normal level in a couple months and below normal by June. This will not cause prices to decline because there are still a miniscule number of competing listings in the MLS, but it could mean that the second half of 2021 could look different from the first, especially if there’s a temporary boost in new listings after the forbearance period ends and the foreclosure moratorium is lifted.
The average mortgage rate rose to 3.02% this month according to Freddie Mac. Even though this is still considered an excellent rate, it understandably weakens the purchasing power for some buyers and reduces the affordability measure for Greater Phoenix overall. When a family making the median income can afford less than 60% of what’s selling, demand is typically expected to suffer. However, buyers with median incomes coming from Los Angeles and San Francisco are used to only affording 9-11% of what’s selling in their home towns, so Greater Phoenix prices look amazing by comparison. In fact, for some the idea of being able to own a home at all is amazing.
Phoenix Real Estate Market Report March 2021
Commentary written by Tina Tamboer, Senior Housing Analyst with The Cromford Report ©2020 Cromford Associates LLC and Tamboer Consulting LLC
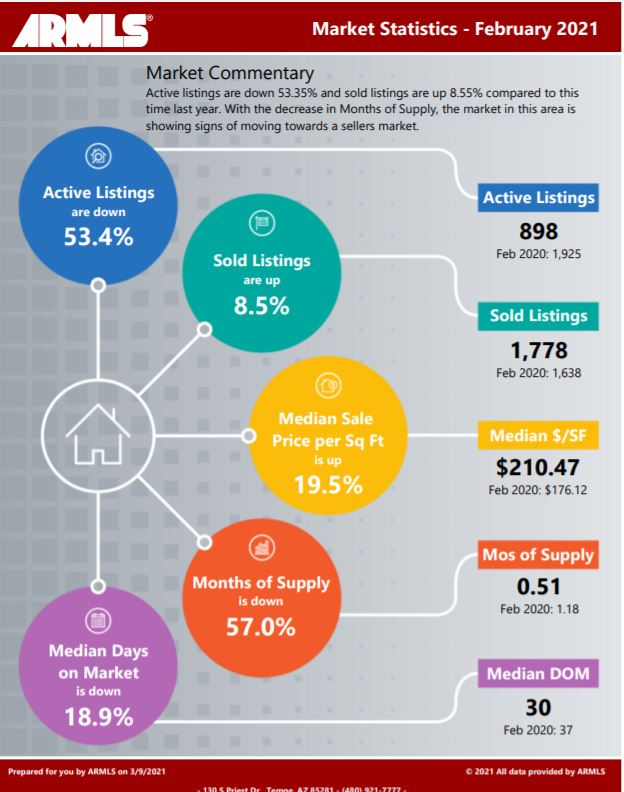
Below you will find the statistical breakdown and more for the Phoenix area Real Estate Market Report February 2021.
View All Current & Past Phoenix & East Valley Real Estate Market Reports
? Below is a snapshot of Phoenix’s Real Estate Market Statistics for February 2021
?️ What are the Average Temperatures in Phoenix?
| Month | Low | High |
|---|---|---|
| Jan | 43.4°F | 65.0°F |
| Feb | 47.0°F | 69.4°F |
| Mar | 51.1°F | 74.3°F |
| Apr | 57.5°F | 83.0°F |
| May | 66.3°F | 91.9°F |
| Jun | 75.2°F | 102.0°F |
| Jul | 81.4°F | 104.2°F |
| Aug | 80.4°F | 102.4°F |
| Sept | 74.5°F | 97.4°F |
| Oct | 62.9°F | 86.4°F |
| Nov | 50.0°F | 73.3°F |
| Dec | 43.5°F | 65.0°F |
Phoenix’s coldest month is January when the average temperature overnight is 43.4°F. In July, the warmest month, the average day time temperature rises to 104.2°F.
If you would like to see specific homes as they come on the market, click here to get email updates.
? A look at Phoenix’s current Sales Price. Real Estate Market Report for March 2021
In February, Phoenix’s Median Sales Price was $321,750 up from last months $315,000 and prior months $310,000. As inventory levels remain at unheard of low levels, there has been continued pressure on the sales price as folks need to bid above the listing price to get the house. If you read Tina’s summary above, there is some hope that prices may stabilize when the forbearance period ends mid year ith more homes then normal hitting the market.
If you are in the process of Buying or Selling a Home, Click on the highlighted link to see a number of interesting articles.
❓ What does this mean if you are a Buyer or a Seller?
Real Estate Market Report
As the chart above shows the Phoenix housing market Inventory is at .51 in February, down from last months .62 and the prior months .56. Buyers should be prepared to jump on any listing that fits their needs. With inventory at record lows, make sure you make your offer as clean as possible (no contingencies). You may have to pay over the list price to get the deal.
Sellers should expect multiple offers due to this low inventory level. We are seeing many more multiple offers as inventory drops. Know the market value of your home. When you start getting offers above list price and potential market price, be cognizant of a potential appraisal issue.
If you would like to see specific homes as they come on the market, click here to get email updates.
?️ What is the annual rainfall in Phoenix?

| Month | Precipitation |
|---|---|
| Jan | 0.83in. |
| Feb | 0.77in. |
| Mar | 1.07in. |
| Apr | 0.25in. |
| May | 0.16in. |
| Jun | 0.09in. |
| Jul | 0.99in. |
| Aug | 0.94in. |
| Sept | 0.75in. |
| Oct | 0.79in. |
| Nov | 0.73in. |
| Dec | 0.92in. |
The driest month in Phoenix is June with 0.09 inches of precipitation, and with 1.07 inches March is the wettest month.
?️ Homes For Sale in Phoenix AZ
Below are Homes that have come on the market in the last 7 Days around the Median price range. Also below the pictures, you will see a Chart of all the Phoenix homes by price and Type: Below are all the homes available in the city of Phoenix by Dollar amount and type:
? Below you will see the links for the other cities in the East Valley:
View All Current & Past Phoenix & East Valley Real Estate Market Reports
Contact the Shirley Coomer Group at Keller Williams Realty Sonoran Living
![]()
Call or Text: 602-770-0643 for more Real Estate Information
Phoenix Real Estate Market Report March 2021