Before we get into the Tempe Real Estate Market Report For July 2020, we have a commentary written by Tina Tamboer. Tina is the Senior Housing Analyst with the Cromford report. She was nice enough to let us use her summary of the Greater Phoenix Metro area as a backdrop for what is happening in Tempe this month. Here is her commentary:
?️ The Greater Phoenix Metro Summary Analysis Real Estate Market Report
? For Buyers -Tempe Real Estate Market Report July 2020
Greater Phoenix has a population of approximately 4.8 million people and 1.4 million single-family homes, condos, and townhomes in total inventory. As of July 8th, only 8,579 of these units were available for sale through the Arizona Regional MLS. If that number doesn’t cause you to gasp, then this might: only 1,023 are single-family homes under $300,000 and that number is diminishing every day.
The last month has seen a surge of buyer activity, but it was not met with an equivalent surge of new listings. New listings overall compared to last year were down 7.8% while contracts in escrow soared 24% higher. For buyers under $300K however, new listings were down 22% in June compared to last year and are down 38% so far in July. This is causing an extreme amount of buyer competition in this price range.
When buyers expand to over $300K, then new home construction starts supplementing inventory and providing some much-needed alternatives. The top 3 cities for single-family home permits are Phoenix, Mesa, and Buckeye with notable spikes in building permits issued in Surprise, Maricopa, and Queen Creek. Most new homes are selling between $300K-$500K, but buyers looking for a brand new single-family home under $300K still have some options. Their best bet is in Pinal County or Buckeye with average sizes between 1,800-2,000 square feet for their budget.
Conversely, new listings over $500K saw a spike last month, up 20% over last year. 1,596 new listing came on the market and 2,046 contracts were accepted in this price range in June.
? For Sellers – Tempe Real Estate Market Report July 2020
Brace yourselves. Half of the sellers who accepted contracts under $400K in the first week of July were on the market for just 8 days or less with their agent prior to contract acceptance. Sellers who took contracts between $400K-$600K had a median of 14 days on the market with their agent and those who landed contracts between $600K-$1M had a median of 41 days. It’s a good time to be a seller.
While 28% of all sales in July so far have closed over asking price, that percentage peaks at 41% for those between $200K-$300K. Top cities for closings over asking price are Tolleson, Avondale, Glendale, Gilbert, and Youngtown. Gilbert is the only city on that list with a median sale price of over $300K.
Seller-assisted closing costs remain popular and were involved in 23% of all sales in the first week of July. That percentage increases to 33% on transactions closed between $150K-$300K. Top areas where 50%-60% of sales involved seller accepted closing cost assistance were Youngtown, West Phoenix, Aguila, Glendale, and Tolleson.
This supports the theory that sellers receiving offers over asking price in the West Valley and other affordable areas are still open to accepting closing cost assistance if a contract meets their most important needs.
The commentary was written by Tina Tamboer, Senior Housing Analyst with The Cromford Report
©2020 Cromford Associates LLC and Tamboer Consulting LLC
Below you will find the statistical breakdown and more for the Tempe area Real Estate Market Report June 2020.
View All Current & Past Phoenix & East Valley Real Estate Market Reports
? Below is a snapshot of Tempe’s Real Estate Market Statistics for June 2020
?️ What are the Average Temperatures in Phoenix?
| Month | Low | High |
|---|---|---|
| Jan | 43.4°F | 65.0°F |
| Feb | 47.0°F | 69.4°F |
| Mar | 51.1°F | 74.3°F |
| Apr | 57.5°F | 83.0°F |
| May | 66.3°F | 91.9°F |
| Jun | 75.2°F | 102.0°F |
| Jul | 81.4°F | 104.2°F |
| Aug | 80.4°F | 102.4°F |
| Sept | 74.5°F | 97.4°F |
| Oct | 62.9°F | 86.4°F |
| Nov | 50.0°F | 73.3°F |
| Dec | 43.5°F | 65.0°F |
Phoenix’s coldest month is January when the average temperature overnight is 43.4°F. In July, the warmest month, the average day time temperature rises to 104.2°F.
If you would like to see specific homes as they come on the market, click here to get email updates.
? A look at Tempe’s current Sales Price. Real Estate Market Report for June 2020
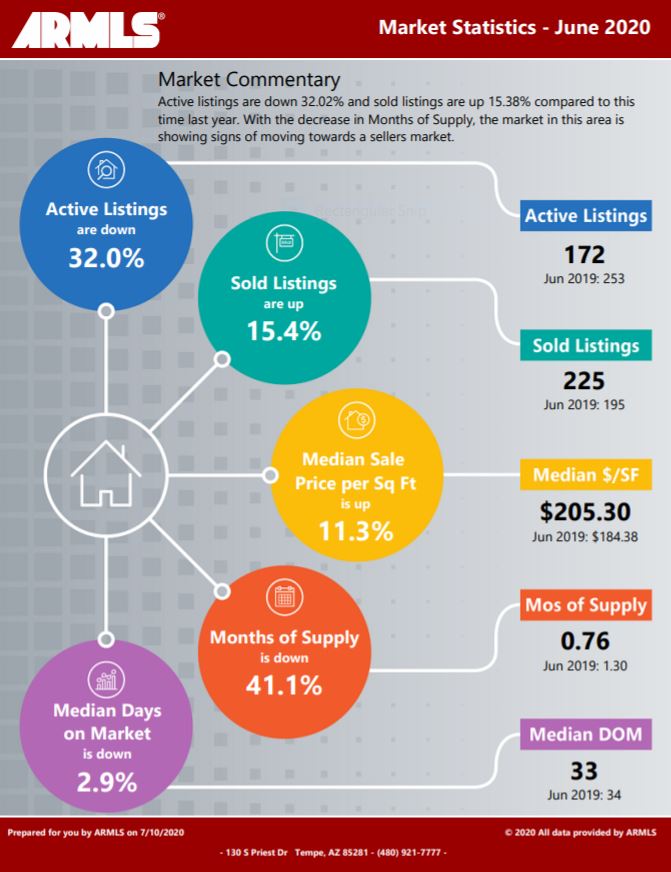
In June, Tempe’s Median Sales Price was $330,000 up from last month’s $310,000. Inventory levels dropped from 1.43 to .76 months of inventory (decrease of 47%). With this extremely low inventory, many deals have multiple offers thus putting pressure on price.
If you are in the process of Buying or Selling a Home, Click on the highlighted link to see a number of interesting articles.
❓ What Does this Market Report Mean if you are a Seller or a Buyer?
Real Estate Market Report
As the chart above shows, Inventory levels dropped from 1.43 to .76 months of inventory (decrease of 47%). With inventory, this low, expect multiple offers. Try to have your offer have no contingencies. Also, make sure you know what market price is…since you may have to go over to get the property.
Sellers should be prepared for multiple bids on their homes. We are seeing this low inventory creating a bidding war where buyers end up bidding above the sales price to get the deal. Know your actual homes market value, since you may have to look at offers over list price. Remember, if the appraisal comes in under the purchase price, it could complicate the deal.
If you would like to see specific homes as they come on the market, click here to get email updates.
?️ What is the annual rainfall in Phoenix?

| Month | Precipitation |
|---|---|
| Jan | 0.83in. |
| Feb | 0.77in. |
| Mar | 1.07in. |
| Apr | 0.25in. |
| May | 0.16in. |
| Jun | 0.09in. |
| Jul | 0.99in. |
| Aug | 0.94in. |
| Sept | 0.75in. |
| Oct | 0.79in. |
| Nov | 0.73in. |
| Dec | 0.92in. |
The driest month in Phoenix is June with 0.09 inches of precipitation, and with 1.07 inches March is the wettest month.
?️ Homes For Sale in Tempe AZ
Below are Homes that have come on the market in the last 7 Days around the Median price range. Also below the pictures, you will see a Chart of all the Tempe homes by price and Type:
Below are all the homes available in the city of Tempe by Dollar amount and type:
? Below you will see the links for the other cities in the East Valley:
View All Current & Past Phoenix & East Valley Real Estate Market Reports
We hope
Contact the Shirley Coomer Group at Keller Williams Realty Sonoran Living

Call or Text: 602-770-0643 for more Real Estate Information
Tempe Real Estate Market Report July 2020


