Before we get into the Tempe Real Estate Market Report for September, I have a commentary written by Tina Tamboer. Tina is the Senior Housing Analyst with the Cromford report. She was nice enough to let us use her summary of the Greater Phoenix Metro area as a backdrop for what is happening in Tempe this month. Here is her commentary…..
?️ The Greater Phoenix Metro Summary Analysis Real Estate Market Report
? For Buyers:
The first few weeks of August saw a surprising 17% spike in listings under contract over $600K. This is highly unusual as typically contract activity declines in the 2nd half of the year, especially on the high end; but this is the year 2020 and it’s been full of surprises.
What is causing this spike in buyer demand in the luxury market? Luxury sales are partially influenced by stock market performance and corporate profits. August was a good month for the stock market, but the 2nd quarter was not good for corporate profits at all. In fact, they fell to levels we haven’t seen in a decade.
The answer may lie in what’s been dubbed “wealth flight”. Some states like California are considering increases in income taxes, corporate taxes and a new “wealth tax” in the wake of the pandemic. As a result, the threat of new taxes on already hurting balance sheets is enough for companies and their employees to make the decision to move.
This, coupled with the work-from-home movement, is fueling demand in Metro Phoenix where taxes and the cost of housing are comparatively more affordable than other cities.
For buyers waiting for prices to decline, there is no indication of that happening soon despite apocalyptic predictions of another foreclosure wave; at least not while the Valley has a net increase in population moving to the area. A reasonable expectation over the next year is that prices will continue to rise sharply in the short term, then possibly rise slower if affordability rates begin to suffer. The only beam of hope for buyers right now is a boost in new construction.
? For Sellers:
For at least 12 years, builders have been reluctant to ramp up production of new housing supply to accommodate population growth; which is understandable considering they were burned severely when the housing market crashed in 2008.
This reluctance has led the market to our current shortage of homes for sale and a frenzy of competition for existing resale homes. However, last July saw over 3,000 single-family permits filed; the largest number filed in a month since March 2007.
This should provide some much-needed relief for buyers and some added competition for sellers in the coming months. While exciting, this increase in new home permits is not alarming. The biggest month recorded was July 2004 with 6,291 permits filed.
That said, 35% of homes closed through the Arizona Regional MLS in August sold over asking price. As incredible as that sounds, this isn’t the first time Greater Phoenix has seen this measure spike. In fact, 2005, 2009, and 2012 all saw higher percentages; each peak was short-lived over the course of just 2-3 months before sharply dropping again.
This is because as more sellers test market limits and ask for higher and higher prices, their likelihood of selling over asking price drops significantly.
Commentary was written by Tina Tamboer, Senior Housing Analyst with The Cromford Report ©2020 Cromford Associates LLC and Tamboer Consulting LLC
Below you will find the statistical breakdown and more for the Tempe area Real Estate Market Report August 2020
View All Current & Past Phoenix & East Valley Real Estate Market Reports
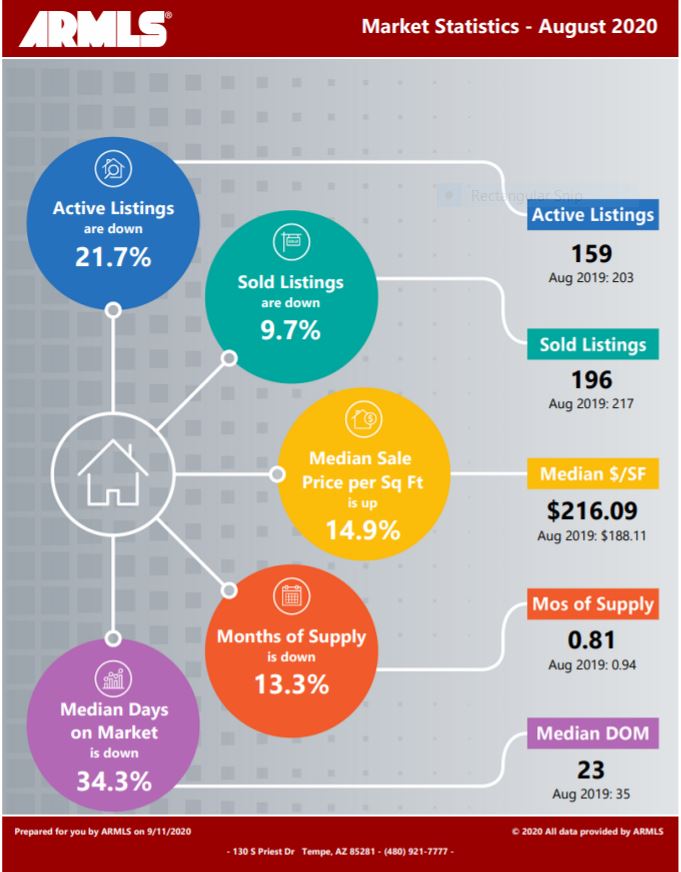
? Below is a snapshot of Tempe’s Real Estate Market Statistics for August 2020
?️ What are the Average Temperatures in Phoenix?
| Month | Low | High |
|---|---|---|
| Jan | 43.4°F | 65.0°F |
| Feb | 47.0°F | 69.4°F |
| Mar | 51.1°F | 74.3°F |
| Apr | 57.5°F | 83.0°F |
| May | 66.3°F | 91.9°F |
| Jun | 75.2°F | 102.0°F |
| Jul | 81.4°F | 104.2°F |
| Aug | 80.4°F | 102.4°F |
| Sept | 74.5°F | 97.4°F |
| Oct | 62.9°F | 86.4°F |
| Nov | 50.0°F | 73.3°F |
| Dec | 43.5°F | 65.0°F |
Phoenix’s coldest month is January when the average temperature overnight is 43.4°F. In July, the warmest month, the average day time temperature rises to 104.2°F.
If you would like to see specific homes as they come on the market, click here to get email updates.
? A look at Tempe’s current Sales Price. Real Estate Market Report for August 2020
Tempe’s Median Sales Price in August was $337,000 up from last month’s $322,500 and the prior months $330,000. With inventory levels remaining low, expect continued pressure on price.
If you are in the process of Buying or Selling a Home, Click on the highlighted link to see a number of interesting articles.
❓ What does this mean if you are a Buyer or a Seller?
Real Estate Market Report
As the chart above shows, Inventory levels went up slightly to.81 months of inventory from last months .70. So, with inventory, this low, buyers should expect multiple offers. Try to have your offer have no contingencies. Also, make sure you know what market price is…since you may have to go over that to get the property.
Sellers should be prepared for multiple bids on their homes. We are seeing this low inventory creating a bidding war where buyers end up bidding above the sales price to get the deal. Know your actual homes market value, since you may have to look at offers over list price. Remember, if the appraisal comes in under the purchase price, it could complicate the deal.
If you would like to see specific homes as they come on the market, click here to get email updates.
?️ What is the annual rainfall in Phoenix?

| Month | Precipitation |
|---|---|
| Jan | 0.83in. |
| Feb | 0.77in. |
| Mar | 1.07in. |
| Apr | 0.25in. |
| May | 0.16in. |
| Jun | 0.09in. |
| Jul | 0.99in. |
| Aug | 0.94in. |
| Sept | 0.75in. |
| Oct | 0.79in. |
| Nov | 0.73in. |
| Dec | 0.92in. |
The driest month in Phoenix is June with 0.09 inches of precipitation, and with 1.07 inches March is the wettest month.
?️ Homes For Sale in Tempe AZ
Below are Homes that have come on the market in the last 7 Days around the Median price range. Also below the pictures, you will see a Chart of all the Tempe homes by price and Type:
Below are all the homes available in the city of Tempe by Dollar amount and type:
? Below you will see the links for the other cities in the East Valley:
View All Current & Past Phoenix & East Valley Real Estate Market Reports
Contact the Shirley Coomer Group at Keller Williams Realty Sonoran Living
![]()
Call or Text: 602-770-0643 for more Real Estate Information.