Before we get into the Chandler Real Estate Market Report for February 2022, I have a commentary written by Tina Tamboer. Tina is the Senior Housing Analyst with the Cromford report. She was nice enough to let us use her summary of the Greater Phoenix Metro area as a backdrop for what is happening in Chandler this month. Here is her commentary…
?️ The Greater Phoenix Metro Summary Analysis Real Estate Market Report
Housing Market is Just as Tough for Buyers over $1M
Median Sale Price up 2.4% Over Last Month
? For Buyers:
Affordability has been dominating the headlines as of late, however, few have been documenting the plight of buyers in the luxury market over $1M. Typically, the higher in price one can go, the more they’d expect to see less buyer competition, more choice, and more negotiating advantage. Not so.
In more expensive areas such as the Central Phoenix/Camelback Corridor, Paradise Valley, Scottsdale, Fountain Hills and Carefree/Cave Creek, the supply of homes is still not sufficient for the demand. This is true even for buyers with budgets from $1M to $3M where 31% of sales close over the asking price and many buyers need to prepare to offer $50,000 or more over market value.
Number of Active and Under Contract Listings
In Paradise Valley, on February 5th there were 85 active listings in the Arizona Regional MLS and 85 in escrow. From 2015-2019, supply ranged from 370-450 active listings in February and 53-93 under contract. So while demand is within range, the fact that there are so few properties to choose from means that competition remains tight. The median time prior to an accepted contract was 13 days and prices rose 34% in the past year; impressive for a city where the median sale price is currently $2.79M.
In the Central/Camelback Corridor of Phoenix, typically there would be 140-200 active listings over $1M and 19-52 under contract. However, on February 5th there were only 55 active and a whopping 88 under contract. The median time on the market prior to the contract was 10 days and property values have risen 28% per square foot since last year.
Similar stories can be heard throughout the luxury market. Scottsdale would typically see 800-1,000 listings over $1M with 80-240 under contract in February. On February 5th there were 274 active and 365 under contract. Buyers have a median of 7 days before a listing over $1M is under contract and 34% of sales closed over list price.
? For Sellers:
The median sales price went up another 2.4% over the past month, which is impressive considering the average mortgage rate increased from 3.11% in December to 3.55% by the end of January, according to Freddie Mac. Buyers who have been waiting for prices to stop accelerating, possibly even flatten out or decline, have been disappointed for at least 18 months in a row as home values appear to defy the affordability limits of the population. Despite prices continuing to rise, there is still an expectation that rising interest rates will eventually influence demand, and thus prices, sometime this year.
Simultaneous Change in Supply and Demand
Frankly, that’s not an unreasonable expectation under normal circumstances. However, the housing market is far from normal right now. Over the course of 30 days, demand has gone from 23% above normal to 19% above normal, so there has been some shifting in demand that can be attributed to mortgage rates and their effect on affordability. But demand is still very high, and supply moved from 72% below normal to 75% below normal during the same time frame. This drop in the supply mitigated any relief the drop in demand would have had on rising prices.
When the total number of homes in an area is insufficient for the number of people living there, the interest rate has less impact on rising home values. There are fewer homes for sellers to move to, so they choose not to place their homes on the market at all. Even if demand falls due to mortgage rate increases, if it remains above normal while supply remains below normal then property values will continue to rise.
Unless the supply of MLS homes for sale achieves a range of 16,000-24,000 listings, prices will continue to rise before demand drops low enough to stop them.
Below you will find the statistical breakdown and more for the Chandler area Real Estate Market Report January 2022.
View All Current & Past Phoenix & East Valley Real Estate Market Reports
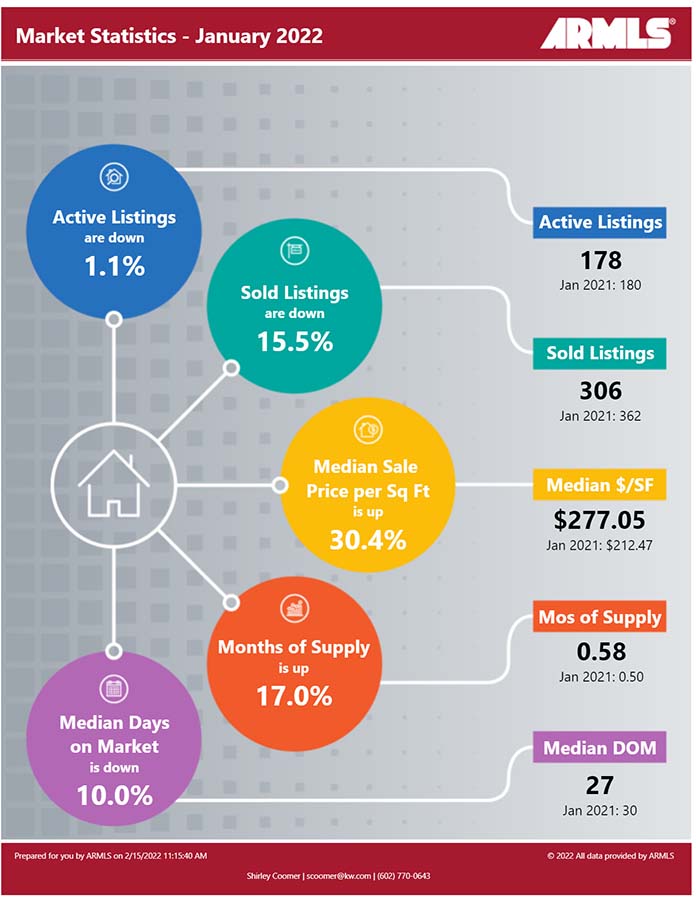
? Below is a snapshot of Chandler’s Real Estate Market Statistics for January 2022
?️ What are the Average Temperatures in Phoenix?
| Month | Low | High |
|---|---|---|
| Jan | 43.4°F | 65.0°F |
| Feb | 47.0°F | 69.4°F |
| Mar | 51.1°F | 74.3°F |
| Apr | 57.5°F | 83.0°F |
| May | 66.3°F | 91.9°F |
| Jun | 75.2°F | 102.0°F |
| Jul | 81.4°F | 104.2°F |
| Aug | 80.4°F | 102.4°F |
| Sept | 74.5°F | 97.4°F |
| Oct | 62.9°F | 86.4°F |
| Nov | 50.0°F | 73.3°F |
| Dec | 43.5°F | 65.0°F |
Phoenix’s coldest month is January when the average temperature overnight is 43.4°F. In July, the warmest month, the average daytime temperature rises to 104.2°F. If you would like to see specific homes as they come on the market, click here to get email updates.
? A look at Chandler’s current Sales Price. Real Estate Market Report for February 2022
In January, Chandler’s Median Sales Price was $494,750 up from last month’s $490,000 and the prior months’ $472,500, $480,000 and $469,900. As inventory levels remain at unheard of low levels, there has been continued pressure on the sales price as folks need to bid above the listing price to be the winning bid on the house.
If you are in the process of Buying or Selling a Home, Click on the highlighted link to see a number of interesting articles.
❓ What does this mean if you are a Buyer or a Seller?
Real Estate Market Report
As the chart above shows the Phoenix housing market Inventory remains at historic low levels. Buyers should be prepared to jump on any listing that fits their needs. With inventory at these lows, make sure you make your offer as clean as possible (no contingencies). Based on Tina’s comments above, you may have to pay over the list price to get the deal.
Sellers should expect multiple offers due to this low inventory level. We are seeing many more multiple offers as inventory drops. Know the market value of your home. When you start getting offers above list price and potential market price, be cognizant of a potential appraisal issue or look for offers with appraisal waivers/contingencies.
If you would like to see specific homes as they come on the market, click here to get email updates.
?️ What is the annual rainfall in Phoenix?

| Month | Precipitation |
|---|---|
| Jan | 0.83in. |
| Feb | 0.77in. |
| Mar | 1.07in. |
| Apr | 0.25in. |
| May | 0.16in. |
| Jun | 0.09in. |
| Jul | 0.99in. |
| Aug | 0.94in. |
| Sept | 0.75in. |
| Oct | 0.79in. |
| Nov | 0.73in. |
| Dec | 0.92in. |
The driest month in Phoenix is June with 0.09 inches of precipitation, and with 1.07 inches March is the wettest month.
?️ Homes For Sale in Chandler AZ
Below are Homes that have come on the market in the last 7 Days around the Median price range. Also below the pictures, you will see a Chart of all the Chandler homes by price and Type: Below are all the homes available in the city of Chandler by Dollar amount and type:
? Below you will see the links for the other cities in the East Valley:
View All Current & Past Phoenix & East Valley Real Estate Market Reports
Contact the Shirley Coomer Group at Keller Williams Realty Sonoran Living

Call or Text: 602-770-0643 for more Real Estate Information.


