Before we get into the Chandler Real Estate Market Report in November 2019, I have a commentary written by Tina Tamboer. She is the Senior Housing Analyst with the Cromford report. She was nice enough to let us use her summary of the Greater Phoenix Metro area as a backdrop for what is happening in Chandler this month. Here is her commentary…….
The Greater Phoenix Metro Summary Analysis Real Estate Market Report
Contracts In Escrow Up 19% Over Last Year. Despite Rising Prices, Affordability is Good
For Buyers:
Buyers waiting for prices to come down have been sorely disappointed so far in 2019. The average sale price per square foot is up 6.7% since last November and the median sales price is now $283,000, up $21,000 from last November’s measure of $262,000.
Despite rising prices, affordability has remained normal throughout the year. One relevant factor is Private Sector Earnings in Greater Phoenix has risen 4.5% annually as interest rates have continually declined. The median family income was measured at $72,900 last quarter and families making that income could afford 68% of what sold last quarter (according to the HOI index published by the National Association of Home Builders and Wells Fargo).
The historical norm for our market is 60-75%. Clearly not all buyers have parked on the fence, demand has hovered 6-7% above normal for our area for about 4 months while supply is 44% below normal. The only measurable relief for buyers
is last month’s supply level was 47% below normal, so it’s 3% less hard to find something suitable.
For Sellers:
The number of listings under contract may have declined 26% from the May seasonal peak, but it’s nearly 19% higher than it was this time last year. This, combined with monthly sales up nearly 15% over last year, is a solid indicator that year-end closings will outperform last year despite a shaky start. Single Family permits (future supply) are up 4.6% year-to-date and multi-family permits are up 6.4%, reaching a level not seen since 2007. Single family home sales are up 5.7%, but new townhouse and
condo sales are down a whopping 30%, which is surprising. Resale condos and townhouses have increased in sales volume this year, so the drop in sales for new construction despite an increase in permits indicates that much of the multi-family units constructed are not for individual sale but are for rent.
This is good news if you’re planning to sell your condo because the majority of developments are not competing for buyers. This is not good news if you’re renting your condo nearby because that’s an increase in competing units for renters. “Apartment style” private condo rental rates per square foot have grown less than 1% over the course of 3.5 years according to the Arizona Regional MLS records.
The commentary was written by Tina Tamboer, Senior Housing Analyst with The Cromford Report
©2019 Cromford Associates LLC and Tamboer Consulting LLC
Below you will find the statistical breakdown and more for the Chandler area Real Estate Market Report November 2019 (with earlier MO and yr data).
View All Current & Past Phoenix & East Valley Real Estate Market Reports
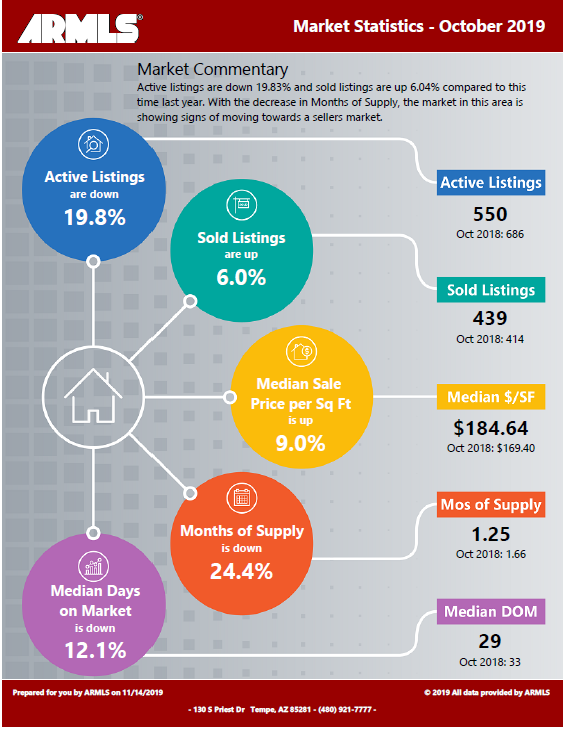
Below is a snapshot of Chandler’s Real Estate Market Statistics for October 2019
A look at Chandler’s current Sales Price. Real Estate Market Report
In October, Chandler’s Median Sales Price was $329,900. This compared to September’s $319,500 a increase of 3.3%. Currently, the YTD average Median price in Chandler is $323,000. This was a .9% increase from last month’s 320,000. This month we had more homes sell in the $500,000 plus range versus last month.
If you are in the process of Buying or Selling a Home, Click on the highlighted link to see a number of interesting articles.
What does this mean if you are a Seller or Buyer?
Real Estate Market Report
As the chart above shows, Inventory in Chandler still remains low (1.25 vs 1.33 months of inventory last month). This is a 6% decrease from last month. Chandler remains in a strong Sellers market. as inventory remains low. The Seller currently has a continued advantage due to such a low number of Homes available on the Market.
Buyers will have to look to make offers that are very competitive in price along with as few contingencies as possible. Buyers should be ready to react quickly when they see a home they want to place an offer on so to beat out the competition. However, dont forget to check comparable sales to ensure that the home is priced correctly.
If you would like to see specific homes as they come on the Market, click here to get email updates.
Homes For Sale in Chandler AZ
Below are Homes that have come on the Market in the last 7 Days around the Median price range. Also below the pictures, you will see a Chart of all the Chandler homes by price and Type:
Below are all the Homes available in the city of Chandler by Dollar amount and type:
Below you will see the links for the other cities in the East Valley:
View All Current & Past Phoenix & East Valley Real Estate Market Reports
Contact the Shirley Coomer Group at Keller Williams Realty Sonoran Living
![]()
Call or Text: 602-770-0643 for more Real Estate Information.