Before we get into the Chandler Real Estate Market Report October 2019, I have a commentary written by Tina Tamboer. She is the Senior Housing Analyst with the Cromford report. She was nice enough to let us use her summary of the Greater Phoenix Metro area as a backdrop for what is happening in Chandler this month. Here is her commentary…….
The Greater Phoenix Metro Summary Analysis Real Estate Market Report
Asking Prices up 9% Over Last Year, but are Buyers Paying It? These Homes have Appreciated the Most since 2000
For Buyers:
The news media is filled with short-term predictions regarding the economy and how it will, or will not, affect real estate prices. It’s understandable for buyers to want their home to appreciate in value after they purchase, who doesn’t? However, there is far too much attention paid to short-term influences and fluctuations these days and not enough attention paid to the long view. Real estate is a long-term investment for many people.
Despite the euphoria of 2005-2007 and the nightmare of 2008-2011, on average homes are selling 81.6% higher today than they were in the year 2000. That’s an average appreciation rate of 4.3% per year over the course of 19 years. Smaller homes appreciated the most over time while larger homes appreciated the least. Homes under 1,000sf have appreciated 122% since 2000, an average of 6.4% per year. Those between 1,000-2,000sf appreciated 106%, an average of 5.6% per year. 2,000-3,000sf appreciated 68% at 3.6% per year. 3,000-4, appreciated 49% at 2.6% per year and homes over 4,000sf appreciated 11% at 0.6% per year.
For Sellers:
Average asking prices per square foot are up 9% over this time last year and they’re continuing to rise. However, not one individual price range has risen 9% or more; confusing, right? That’s because the sharp increase in the average has more to do with a growing market share of luxury active listings over $500K as inventory has plummeted everywhere else. The highest increase is within $200K-$250K, where sellers are asking 5.6% more than they were last year.
That’s followed by listings over $1M where they’re asking 4.2% more and $500K-$1M at 4.0%. All other price ranges are just 1-3% higher. But are buyers paying? Actually, many of them are! In the $200K-$250K range, the average sales price per square foot is still 0.8% higher than the average list price; and between $250-$300K the average sales price is 6.8% higher than the average list per square foot. Things change over $500K. Between $500K-$1M there’s a -6.3% gap between asking price and sales price and over $1M the average sales price is -15.1% below the average asking price.
The commentary was written by Tina Tamboer, Senior Housing Analyst with The Cromford Report ©2019 Cromford Associates LLC and Tamboer Consulting LLC
Below you will find the statistical breakdown and more for the Chandler area Real Estate Market Report October 2019 (with prior MO and yr data).
View All Current & Past Phoenix & East Valley Real Estate Market Reports
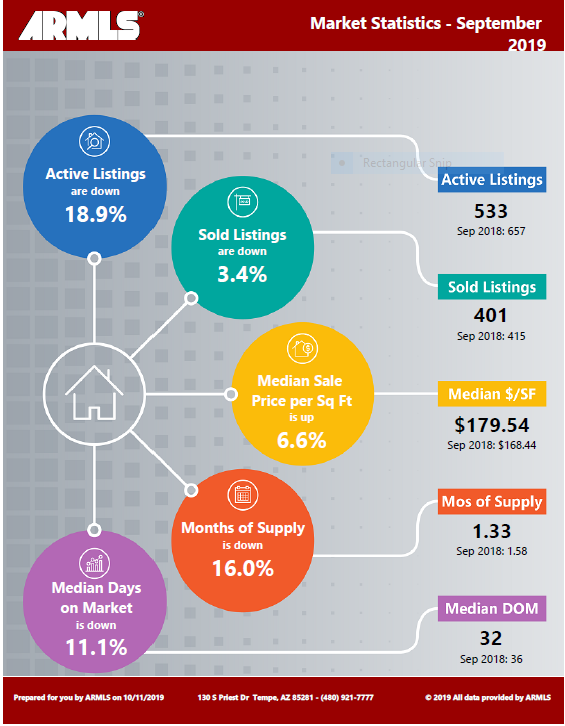
Below is a snapshot of Chandler’s Real Estate Market Statistics for September 2019
A look at Chandler’s current Sales Price. Real Estate Market Report
In September, Chandler’s Median Sales Price was $319,500. This compared to August’s $335,000 a decrease of 3.0%. Currently, the YTD average Median price in Chandler is $320,000. This was a .2% decrease from last month’s 320,500. This month we had more homes sell in the $200,000 to $350,000 range versus the higher-priced ranges.
If you are in the process of Buying or Selling a Home, Click on the highlighted link to see a number of interesting articles.
What does this mean if you are a Seller or a Buyer?
Real Estate Market Report
As the chart above shows, Inventory in Chandler remains low (1.33 months of inventory). This is a 15.8% increase from last month but we are still in a strong seller’s market here in Chandler. We will need to watch inventory closely as we have now shown increases over the last 2 months. The Seller currently has a continued advantage due to such a low number of Homes available on the Market.
Buyers will have to look to make offers that are very competitive in price along with as few contingencies as possible. Buyers should be ready to react quickly when they see a home they want to place an offer on so to beat out the competition.
If you would like to see specific homes as they come on the Market, click here to get email updates.
Homes For Sale in Chandler AZ
Below are Homes that have come on the Market in the last 7 Days around the Median price range. Also below the pictures, you will see a Chart of all the Chandler homes by price and Type:
Below are all the Homes available in the city of Chandler by Dollar amount and type:
Below you will see the links for the other cities in the East Valley:
View All Current & Past Phoenix & East Valley Real Estate Market Reports
Contact the Shirley Coomer Group at Keller Williams Realty Sonoran Living
![]()
Call or Text: 602-770-0643 for more Real Estate Information.