Before we get into the Phoenix Real Estate Market Report for January 2021, I have a commentary written by Tina Tamboer. Tina is the Senior Housing Analyst with the Cromford report. She was nice enough to let us use her summary of the Greater Phoenix Metro area as a backdrop for what is happening in Phoenix this month. Here is her commentary…..
?️ The Greater Phoenix Metro Summary Analysis Real Estate Market Report
2020 Broke the Record for Luxury Sales
Supply Down 51%, Slim Pickings in 2021
? For Buyers:
There were 111,036 new listings added to the Arizona Regional MLS (ARMLS) in 2020, only 38 more than in 2019, while 100,650 sold. As of January 10th, 2021 there were only 6,162 listings still active in the MLS, which is the lowest supply count recorded in at least 20 years. To make matters worse, 10% of those properties are outside of the Greater Phoenix boundary.
While the number of new listings barely changed last year, demand for homes accelerated between June and December to 35% above normal. Luxury sales over $1M soared after the pandemic restrictions were lifted. While they were already up 7.7% over 2019 at the end of June, by the end of December annual luxury sales were up 48.7%, securing an enormous record for 2020 at 2,575 sales over $1M.
Outside of the MLS, new home developers have been struggling to meet demand as well. Despite the roadblocks in production due to the pandemic, forest fires, and supply line disruptions, as of November builders still managed to sell 14% more homes and obtain 28,204 more single-family permits for future supply, up 24% over 2019. The median price of a new single-family home only rose 6% from $333K to $353K and considering the median price of a resale home is $335K, that’s extremely competitive.
As supply began to drop last month, December saw 33% of sales closed over the asking price, and only 10% involved seller-paid closing costs in the 4th Quarter. The bottom line for buyers starting their search in 2021, be on top of your loan and be ready to pounce on every new listing that fits your needs. Many new listings will be on the market for less than a week prior to accepting a contract.
? For Sellers:
Below you will find the statistical breakdown and more for the Phoenix area Real Estate Market Report December 2020.
View All Current & Past Phoenix & East Valley Real Estate Market Reports
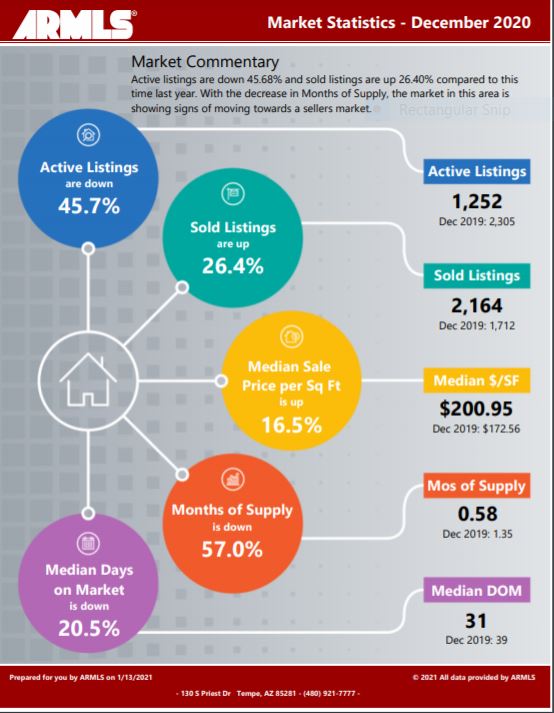
? Below is a snapshot of Phoenix’s Real Estate Market Statistics for December 2020
?️ What are the Average Temperatures in Phoenix?
| Month | Low | High |
|---|---|---|
| Jan | 43.4°F | 65.0°F |
| Feb | 47.0°F | 69.4°F |
| Mar | 51.1°F | 74.3°F |
| Apr | 57.5°F | 83.0°F |
| May | 66.3°F | 91.9°F |
| Jun | 75.2°F | 102.0°F |
| Jul | 81.4°F | 104.2°F |
| Aug | 80.4°F | 102.4°F |
| Sept | 74.5°F | 97.4°F |
| Oct | 62.9°F | 86.4°F |
| Nov | 50.0°F | 73.3°F |
| Dec | 43.5°F | 65.0°F |
Phoenix’s coldest month is January when the average temperature overnight is 43.4°F. In July, the warmest month, the average day time temperature rises to 104.2°F. If you would like to see specific homes as they come on the market, click here to get email updates.
? A look at Phoenix’s current Sales Price. Real Estate Market Report for December 2020
In December, Phoenix’s Median Sales Price was $310,000 flat from last month’s $309,000. As inventory levels remain at unheard of low levels, we would expect there to be pressure on the price. But, the Median price is also driven by availability in different locations in the Phoenix area. So when monitoring price, make sure you are looking at a specific area you interested in, not the whole city.
If you are in the process of Buying or Selling a Home, Click on the highlighted link to see a number of interesting articles.
❓ What does this mean if you are a Buyer or a Seller?
Real Estate Market Report
As the chart above shows the Phoenix housing market Inventory is at .56 months down from last month’s .86. Buyers should be prepared to jump on any listing that fits their needs. Review Tina’s buyer comments above. With inventory at record lows, make sure you make your offer as clean as possible (no contingencies). You may have to pay over the list price to get the deal.
Sellers should expect multiple offers due to this low inventory level. We are seeing many more multiple offers as inventory drops. Know the market value of your home. When you start getting offers above list price and potential market price, be cognizant of a potential appraisal issue.
If you would like to see specific homes as they come on the market, click here to get email updates.
?️ What is the annual rainfall in Phoenix?

| Month | Precipitation |
|---|---|
| Jan | 0.83in. |
| Feb | 0.77in. |
| Mar | 1.07in. |
| Apr | 0.25in. |
| May | 0.16in. |
| Jun | 0.09in. |
| Jul | 0.99in. |
| Aug | 0.94in. |
| Sept | 0.75in. |
| Oct | 0.79in. |
| Nov | 0.73in. |
| Dec | 0.92in. |
The driest month in Phoenix is June with 0.09 inches of precipitation, and with 1.07 inches March is the wettest month.
?️ Homes For Sale in Phoenix AZ
Below are Homes that have come on the market in the last 7 Days around the Median price range. Also below the pictures, you will see a Chart of all the Phoenix homes by price and Type: Below are all the homes available in the city of Phoenix by Dollar amount and type:
? Below you will see the links for the other cities in the East Valley:
View All Current & Past Phoenix & East Valley Real Estate Market Reports
Contact the Shirley Coomer Group at Keller Williams Realty Sonoran Living
![]()
Call or Text: 602-770-0643 for more Real Estate Information.