Before we get into the Chandler Real Estate Market Report for January 2021, I have a commentary written by Tina Tamboer. Tina is the Senior Housing Analyst with the Cromford report. She was nice enough to let us use her summary of the Greater Phoenix Metro area as a backdrop for what is happening in Chandler this month. Here is her commentary…..
?️ The Greater Phoenix Metro Summary Analysis Real Estate Market Report
2020 Broke the Record for Luxury Sales
Supply Down 51%, Slim Pickings in 2021
? For Buyers:
There were 111,036 new listings added to the Arizona Regional MLS (ARMLS) in 2020, only 38 more than in 2019, while 100,650 sold. As of January 10th, 2021 there were only 6,162 listings still active in the MLS, which is the lowest supply count recorded in at least 20 years. To make matters worse, 10% of those properties are outside of the Greater Phoenix boundary.
While the number of new listings barely changed last year, demand for homes accelerated between June and December to 35% above normal. Luxury sales over $1M soared after the pandemic restrictions were lifted. While they were already up 7.7% over 2019 at the end of June, by the end of December annual luxury sales were up 48.7%, securing an enormous record for 2020 at 2,575 sales over $1M.
Outside of the MLS, new home developers have been struggling to meet demand as well. Despite the roadblocks in production due to the pandemic, forest fires, and supply line disruptions, as of November builders still managed to sell 14% more homes and obtain 28,204 more single-family permits for future supply, up 24% over 2019.
Buyers
The median price of a new single-family home only rose 6% from $333K to $353K and considering the median price of a resale home is $335K, that’s extremely competitive.
As supply began to drop last month, December saw 33% of sales closed over the asking price, and only 10% involved seller-paid closing costs in the 4th Quarter. The bottom line for buyers starting their search in 2021, be on top of your loan and be ready to pounce on every new listing that fits your needs. Many new listings will be on the market for less than a week prior to accepting a contract.
? For Sellers:
The state of Arizona ranked 3rd in the nation for population growth behind Texas and Florida in the latest 2020 Census release. When the full report comes out later this year, we expect to see California as the #1 source of inbound migration for Greater Phoenix. Moving companies such as Atlas, United Van Lines, and North American have released their annual migration reports, and 2 out of the 3 lists Arizona in their Top 5 states for inbound moves. United Van Lines specifically cites “retirement” as the primary reason for 37% of inbound moves, 70% were over 55 years old and 63% made incomes over $100,000 per year.
While median home prices have risen 15.5% year-over-year, the median rental rates through ARMLS have also risen 12.9% from $1,550 to $1,750/month. This increase, combined with historically low mortgage rates, has fueled more demand to purchase.
Sellers
As the population continues to grow, the housing gap is becoming harder to close. After a decade of underbuilding, this will take more than a few months or a year to correct. However, as prices rise and affordability quickly drops, it’s reasonable to expect some demand to drop with it. With that expectation, home prices are still projected to rise throughout 2021 but possibly at a slower rate in the latter half of the year. It will be another great year for sellers.
The commentary was written by Tina Tamboer, Senior Housing Analyst with The Cromford Report ©2020 Cromford Associates LLC and Tamboer Consulting LLC
Below you will find the statistical breakdown and more for the Chandler area Real Estate Market Report December 2020.
View All Current & Past Phoenix & East Valley Real Estate Market Reports
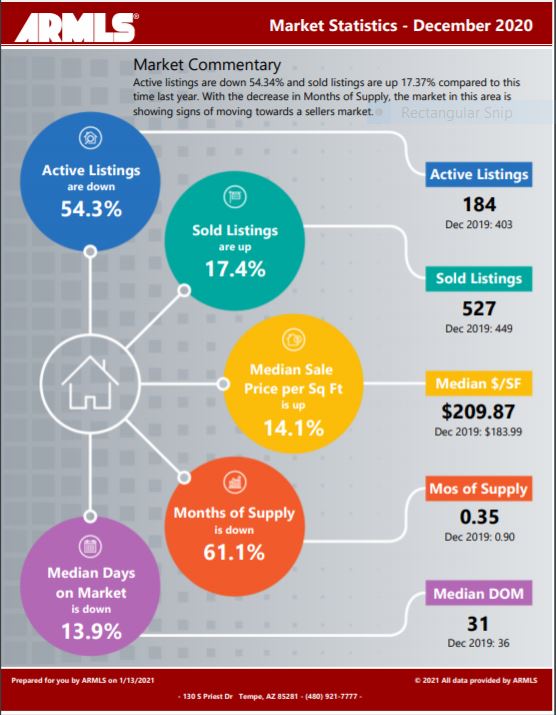
? Below is a snapshot of Chandler’s Real Estate Market Statistics for December 2020
?️ What are the Average Temperatures in Phoenix?
| Month | Low | High |
|---|---|---|
| Jan | 43.4°F | 65.0°F |
| Feb | 47.0°F | 69.4°F |
| Mar | 51.1°F | 74.3°F |
| Apr | 57.5°F | 83.0°F |
| May | 66.3°F | 91.9°F |
| Jun | 75.2°F | 102.0°F |
| Jul | 81.4°F | 104.2°F |
| Aug | 80.4°F | 102.4°F |
| Sept | 74.5°F | 97.4°F |
| Oct | 62.9°F | 86.4°F |
| Nov | 50.0°F | 73.3°F |
| Dec | 43.5°F | 65.0°F |
Phoenix’s coldest month is January when the average temperature overnight is 43.4°F. In July, the warmest month, the average day time temperature rises to 104.2°F. If you would like to see specific homes as they come on the market, click here to get email updates.
? A look at Chandler’s current Sales Price. Real Estate Market Report for December 2020
In December, Chandler’s Median Sales Price was $390,000 up from last month’s $378,000, but flat from 2 months ago. With inventory continuing to run at the historic lows, listings are getting multiple bids thus putting pressure on the price. We should see this continue.
If you are in the process of Buying or Selling a Home, Click on the highlighted link to see a number of interesting articles.
❓ What does this mean if you are a Buyer or a Seller?
Real Estate Market Report
As the chart above shows, Inventory in Chandler continues to drop. This month we are at .35 months of inventory as compared to last months .56 months and the prior months .59 & .61. Buyers should expect multiple offers since the inventory is so low. Make your offers with as few contingencies as possible. Review Tina’s comments above. Know the Market Value of the home because you may need to go over the list price to get the house.
Sellers should be prepared for multiple bids on their homes. We are seeing these historic low inventory levels creating a bidding war which is putting pressure on the buyers to bid above the sales price to get the home. Know the market value of your home, so you don’t accept an offer that causes an appraisal issue.
If you would like to see specific homes as they come on the market, click here to get email updates.
?️ What is the annual rainfall in Phoenix?

| Month | Precipitation |
|---|---|
| Jan | 0.83in. |
| Feb | 0.77in. |
| Mar | 1.07in. |
| Apr | 0.25in. |
| May | 0.16in. |
| Jun | 0.09in. |
| Jul | 0.99in. |
| Aug | 0.94in. |
| Sept | 0.75in. |
| Oct | 0.79in. |
| Nov | 0.73in. |
| Dec | 0.92in. |
The driest month in Phoenix is June with 0.09 inches of precipitation, and with 1.07 inches March is the wettest month.
?️ Homes For Sale in Chandler AZ
Below are Homes that have come on the market in the last 7 Days around the Median price range. Also below the pictures, you will see a Chart of all the Chandler homes by price and Type: Below are all the homes available in the city of Chandler by Dollar amount and type:
? Below you will see the links for the other cities in the East Valley:
View All Current & Past Phoenix & East Valley Real Estate Market Reports
Contact the Shirley Coomer Group at Keller Williams Realty Sonoran Living
![]()
Call or Text: 602-770-0643 for more Real Estate Information.