Before we get into the Phoenix Real Estate Market Report for October 2020, I have a commentary written by Tina Tamboer. Tina is the Senior Housing Analyst with the Cromford report. She was nice enough to let us use her summary of the Greater Phoenix Metro area as a backdrop for what is happening in Phoenix this month. Here is her commentary…..
?️ The Greater Phoenix Metro Summary Analysis Real Estate Market Report
Homes Under Contract Up 36% / Sales Up 23%
Median Sale Price Up 18%
? For Buyers:
A common complaint in the resale market is “there’s nothing for sale”. However, from July through September, the Realtor® community added 30,340 brand new listings to the Arizona Regional MLS and sold 27,746, leaving just 8,203 remaining listings for sale. That makes this 3rd Quarter the 2nd best in Greater Phoenix history for closings, falling just 436 sales short of 2005. If that’s not impressive enough, there are another 13,502 properties currently under contract and scheduled to close in the next 30-45 days; up 36% from this time last year. With this information, we can conclude that there is plenty for sale, but many listings are simply not in Active status longer than 24 hours in order to be counted. Getting the supply count to rise right now is like trying to fill a bathtub when the drain is wide open.
Over half of all listings that went under contract in the 3rd Quarter were Active for only 9 days or less prior to contract. To quote the movie “Spaceballs”, that’s ludicrous speed! As exhausting and stressful as it is for buyers and their agents, supply and demand measures indicate prices in Greater Phoenix will continue to rise well into 2021. Hopefully, the short-term pain will lead to long-term gain for those who ultimately win a successful contract.
? For Sellers:
Appreciation has accelerated significantly since June of this year. The median sale price is up 18% since last October, but the current measure of $329,900 is up 12% from where it was just 4 months ago at $295,000. While that’s exciting for sellers, the speed at which homes are selling is causing some to worry they will not find somewhere to go after their home closes. As a result, Realtors® are dusting off rarely used seller contingency addendums stating that any accepted contract will be contingent on the seller finding a home themselves prior to close.
Compared to last year, sellers are asking 15-20% more for their homes in all price ranges between $150K-$500K. Between $500K-$1M, list prices are up 9-13%, and 3-8% for price ranges over $1M. The highest percentage of sales over asking price in the last 30 days are occurring between $200K-$400K with a measure of 34-45%. While that’s a high percentage, it’s not the majority of sales. Most properties are still closing at or below the asking price. However, for those who did go over the asking price under $400K, most winning bids were within $7,000 of the list price.
The commentary was written by Tina Tamboer, Senior Housing Analyst with The Cromford Report
©2020 Cromford Associates LLC and Tamboer Consulting LLC
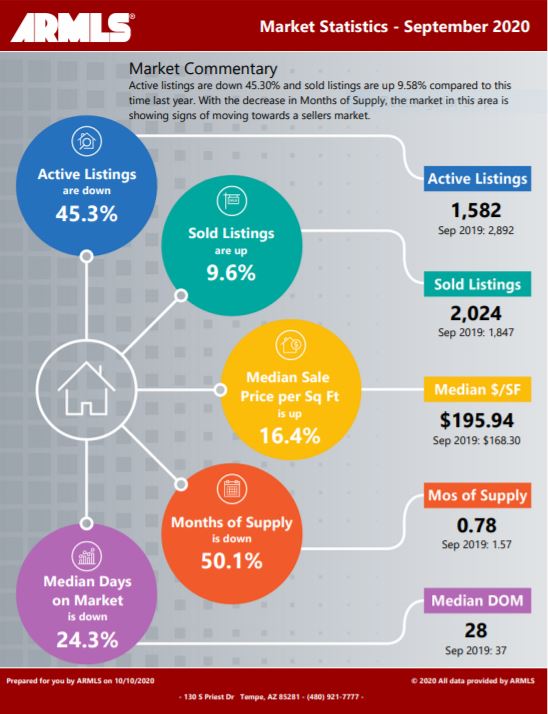
Below you will find the statistical breakdown and more for the Phoenix area Real Estate Market Report September 2020.
View All Current & Past Phoenix & East Valley Real Estate Market Reports
? Below is a snapshot of Phoenix’s Real Estate Market Statistics for September 2020
?️ What are the Average Temperatures in Phoenix?
| Month | Low | High |
|---|---|---|
| Jan | 43.4°F | 65.0°F |
| Feb | 47.0°F | 69.4°F |
| Mar | 51.1°F | 74.3°F |
| Apr | 57.5°F | 83.0°F |
| May | 66.3°F | 91.9°F |
| Jun | 75.2°F | 102.0°F |
| Jul | 81.4°F | 104.2°F |
| Aug | 80.4°F | 102.4°F |
| Sept | 74.5°F | 97.4°F |
| Oct | 62.9°F | 86.4°F |
| Nov | 50.0°F | 73.3°F |
| Dec | 43.5°F | 65.0°F |
Phoenix’s coldest month is January when the average temperature overnight is 43.4°F. In July, the warmest month, the average day time temperature rises to 104.2°F.
If you would like to see specific homes as they come on the market, click here to get email updates.
? A look at Phoenix’s current Sales Price. Real Estate Market Report for October 2020
In September, Phoenix’s Median Sales Price was $310,000 up from last month’s $307,500. As inventory levels remain at unheard of low levels, we would expect there to be upward pressure on the price. With no change in the short term, expect this to continue.
If you are in the process of Buying or Selling a Home, Click on the highlighted link to see a number of interesting articles.
❓ What does this mean if you are a Buyer or a Seller?
Real Estate Market Report
As the chart above shows the Phoenix housing market Inventory is at .78 months up from last months .76. Buyers should be prepared for multiple offers. Make sure you make your offer as clean as possible (no contingencies). You may have to pay over list price to get the deal.
Sellers should expect multiple offers due to the low inventory. We are seeing many more multiple offers with the inventory so low. Know the market value of your home. If you start getting offers above list price and potential market price, you could be creating an appraisal issue based on what offer you take.
If you would like to see specific homes as they come on the market, click here to get email updates.
?️ What is the annual rainfall in Phoenix?

| Month | Precipitation |
|---|---|
| Jan | 0.83in. |
| Feb | 0.77in. |
| Mar | 1.07in. |
| Apr | 0.25in. |
| May | 0.16in. |
| Jun | 0.09in. |
| Jul | 0.99in. |
| Aug | 0.94in. |
| Sept | 0.75in. |
| Oct | 0.79in. |
| Nov | 0.73in. |
| Dec | 0.92in. |
The driest month in Phoenix is June with 0.09 inches of precipitation, and with 1.07 inches March is the wettest month.
?️ Homes For Sale in Phoenix AZ
Below are Homes that have come on the market in the last 7 Days around the Median price range. Also below the pictures, you will see a Chart of all the Phoenix homes by price and Type:
Below are all the homes available in the city of Phoenix by Dollar amount and type:
? Below you will see the links for the other cities in the East Valley:
View All Current & Past Phoenix & East Valley Real Estate Market Reports
Contact the Shirley Coomer Group at Keller Williams Realty Sonoran Living
![]()
Call or Text: 602-770-0643 for more Real Estate Information.