Before we get into the Tempe Real Estate Market Report for September 2021, I have a commentary written by Tina Tamboer. Tina is the Senior Housing Analyst with the Cromford report. She was nice enough to let us use her summary of the Greater Phoenix Metro area as a backdrop for what is happening in Tempe this month. Here is her commentary…
?️ The Greater Phoenix Metro Summary Analysis Real Estate Market Report
Contract Activity Spiked 20% In This Price Range
Luxury Sellers Over $1M Enjoying a Hot Summer
? For Buyers:
Buyer demand has rallied sharply over the past 4 weeks, which is unusual for this time of year. The rally is exclusively between $400K-$800K, spiking nearly 20% in contract activity since the end of July. We have to wait until the transactions close and record to identify the buyers, but judging from July’s closing analysis we expect to find a surge in iBuyer purchases (aka “Internet Buyers”). The most notable iBuyers active in Greater Phoenix are OpenDoor, OfferPad, Zillow, and now RedFin. At least one of these organizations has increased their approved acquisition price to a $750,000 limit, which could explain the sudden spike in sales.
How do iBuyers affect the Real Estate Market?
iBuyers do not buy and hold property, they primarily engage in a short-term flip strategy and their activity does not constitute true demand. True demand is someone who will live in the home or rent it to someone who will live in the home. Flip investors are strictly the middlemen between the seller and the final buyer, which adds one extra closing to the books and makes true demand appear larger than reality by increasing the total number of sales without increasing the level of supply.
The existence of institutional flip investors in the marketplace can be frustrating for buyers from a competition standpoint, but in the end these buyers still need to re-sell the home to someone. As prices have reached levels beyond the affordability threshold for a larger percentage of residents, the question is whether or not iBuyers will be able to flip their acquisitions with the same profit margins going forward.
New Construction
Permits for new homes are up 32% for January through July this year and are at their highest since 2006. Considering the average build time for a new home is anywhere from 10-14 months due to supply chain disruptions, iBuyers and sellers in general may be seeing more competition from new construction starting in the 4th quarter 2021 and into early 2022.
? For Sellers:
While the $400K-$800K market is seeing elevated activity, the luxury market over $1M is a different story. Make no mistake, the luxury market is still extremely hot but it’s not because buyer activity is rising. Listings in escrow over $1M have dropped 17% since June, but that’s normal for this time of year in this segment. The reason the luxury market is still hot is due to a simultaneous drop in competing supply. It’s more prominent over $1.5M where supply has dropped 10%, also since June. So if contract activity isn’t rising, then why is supply over $1M dropping? It’s seasonal. Every year from May to July there’s an elevated number of cancelled and expired listings in this price point, which reduces the number of active listings. This year was no different.
Additionally, the number of new listings added monthly to supply dropped 26% between April and August, which meant there were fewer new listings to replenish those that cancelled or expired. The result is a luxury supply count 31% lower than this time last year. This is good news for the sellers who remained active over the summer. Even though luxury demand came down, it’s still 21% higher than it was last September with fewer competitors. If the market follows its seasonal tendencies there will be a rally of new listings coming to the party in October, possibly giving buyers more choice in the 4th quarter.
The Commentary was written by Tina Tamboer, Senior Housing Analyst with The Cromford Report
©2021 Cromford Associates LLC and Tamboer Consulting LLC
Below you will find the statistical breakdown and more for the Tempe area Real Estate Market Report August 2021.
View All Current & Past Phoenix & East Valley Real Estate Market Reports
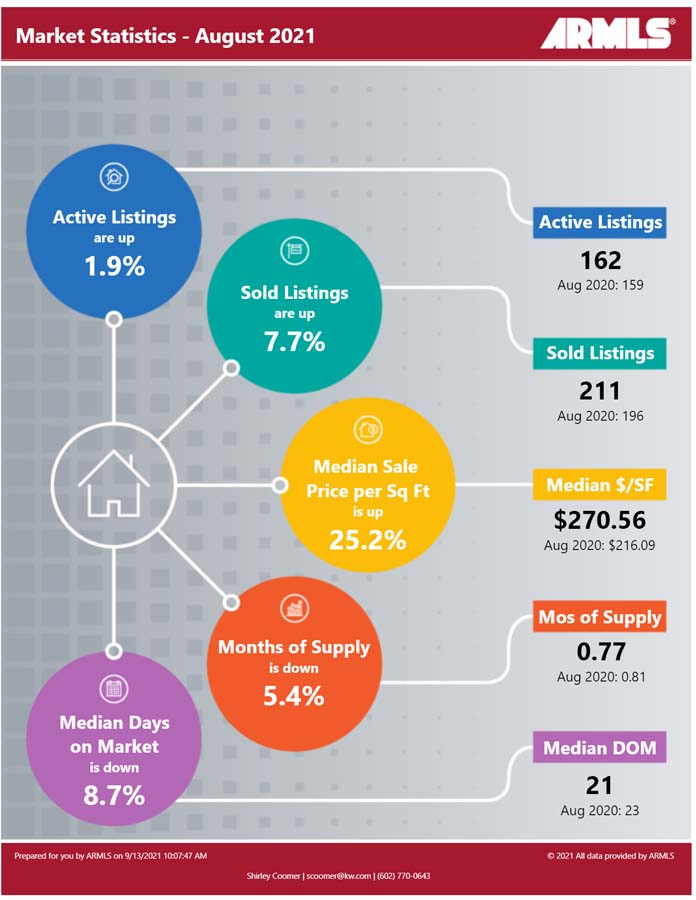
? Below is a snapshot of Tempe’s Real Estate Market Statistics for August 2021
?️ What are the Average Temperatures in Phoenix?
| Month | Low | High |
|---|---|---|
| Jan | 43.4°F | 65.0°F |
| Feb | 47.0°F | 69.4°F |
| Mar | 51.1°F | 74.3°F |
| Apr | 57.5°F | 83.0°F |
| May | 66.3°F | 91.9°F |
| Jun | 75.2°F | 102.0°F |
| Jul | 81.4°F | 104.2°F |
| Aug | 80.4°F | 102.4°F |
| Sept | 74.5°F | 97.4°F |
| Oct | 62.9°F | 86.4°F |
| Nov | 50.0°F | 73.3°F |
| Dec | 43.5°F | 65.0°F |
Phoenix’s coldest month is January when the average temperature overnight is 43.4°F. In July, the warmest month, the average day time temperature rises to 104.2°F. If you would like to see specific homes as they come on the market, click here to get email updates.
? A look at Tempe’s current Sales Price. Real Estate Market Report for September 2021
In August, Tempe’s Median Sales Price was $429,000 up from last month’s $421,580 and the prior months’ $415,000, $425,000 and $389,450. As inventory levels remain at unheard of low levels, there has been continued pressure on the sales price as folks need to bid above the listing price to be the winning bid on the house.
If you are in the process of Buying or Selling a Home, Click on the highlighted link to see a number of interesting articles.
❓ What does this mean if you are a Buyer or a Seller?
Real Estate Market Report
As the chart above shows the Phoenix housing market Inventory remains at historic low levels. Buyers should be prepared to jump on any listing that fits their needs. With inventory at these lows, make sure you make your offer as clean as possible (no contingencies). Since competition in the market is still high, you may want to consider offering over list price if the property value justifies it.
Sellers should expect multiple offers due to this low inventory level. We are seeing many more multiple offers as inventory drops. Know the market value of your home. When you start getting offers above list price and potential market price, be cognizant of a potential appraisal issue or look for offers with appraisal waivers/contingencies.
If you would like to see specific homes as they come on the market, click here to get email updates.
?️ What is the annual rainfall in Phoenix?

| Month | Precipitation |
|---|---|
| Jan | 0.83in. |
| Feb | 0.77in. |
| Mar | 1.07in. |
| Apr | 0.25in. |
| May | 0.16in. |
| Jun | 0.09in. |
| Jul | 0.99in. |
| Aug | 0.94in. |
| Sept | 0.75in. |
| Oct | 0.79in. |
| Nov | 0.73in. |
| Dec | 0.92in. |
The driest month in Phoenix is June with 0.09 inches of precipitation, and with 1.07 inches March is the wettest month.
?️ Homes For Sale in Tempe AZ
Below are Homes that have come on the market in the last 7 Days around the Median price range. Also below the pictures, you will see a Chart of all the Tempe homes by price and Type: Below are all the homes available in the city of Tempe by Dollar amount and type:
? Below you will see the links for the other cities in the East Valley:
View All Current & Past Phoenix & East Valley Real Estate Market Reports
Contact the Shirley Coomer Group at Keller Williams Realty Sonoran Living
![]()
Call or Text: 602-770-0643 for more Real Estate Information.